
|
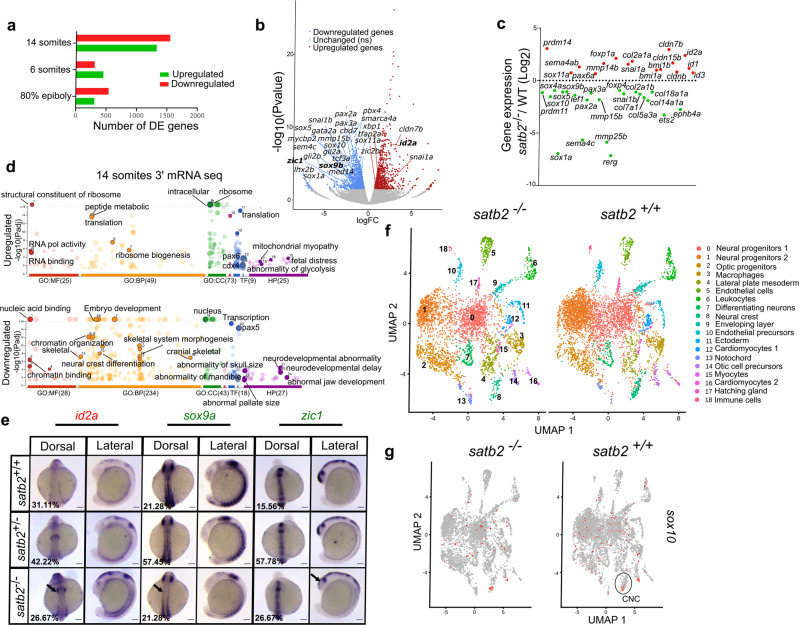
Fig. 2 a Bar plot for the number of upregulated (red) and downregulated (green) genes from 3′ mRNA-seq datasets at the respective stages. b Volcano plot of differentially expressed genes at 14 ss embryonic stage. DE genes with FDR < 0.1 and log2 fold change > ±0.58 are colored as red for significantly upregulated, blue for significantly downregulated, and gray for unchanged or non-significant genes. Few significantly differentially expressed genes representing GO categories neural crest differentiation, neurogenesis, and cranial skeletal system development are highlighted. c Scatter plot for log2 fold change in gene expression of various gene families belonging to the above-mentioned GO categories. d GO analysis of dysregulated genes at 14 ss highlighting significant classes under molecular function (MF), biological processes (BP), cellular components (CC), transcription factors (TF) and human pathology (HP) categories. e Dorsal and lateral view of WISH for id2a (upregulated) n = 48, N = 3; sox9a, n = 47, N = 3 and zic1, n = 45, N = 3 (downregulated). Arrows in the respective images mark the region of maximum differences in the expression pattern. Scale bar = 100 µm. f UMAP clusters illustrate 19 distinct cell types through integrated scRNAseq analysis on satb2−/− and satb2+/+ embryos at 14 ss. g UMAP highlighting (circled) cranial neural crest cells cluster expressing sox10.