IMAGE

Fig. 2

ID
ZDB-IMAGE-211118-51
Source
Figures for Hunter et al., 2021
Image
Figure Caption

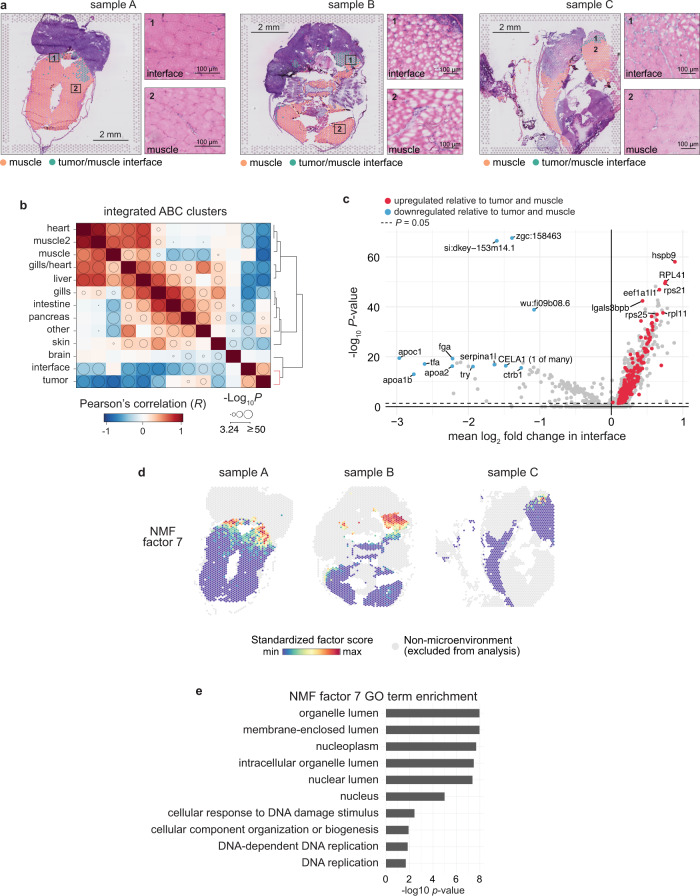
Fig. 2 The tumor–microenvironment interface is transcriptionally distinct from the surrounding microenvironment.

a Interface and muscle-annotated cluster spots projected onto tissue image (n = 3 sections). Insets show the tissue underlying the interface spots (1) and muscle spots (2). b Correlation matrix between average expression profile of SRT clusters across all three datasets. Clusters are ordered by hierarchical clustering of the Pearson’s correlation coefficients (see “Methods” section) and bubble sizes correspond to p-value (−log10) of correlation (two-sided), with p-values < 10−3 omitted. Clustering of tumor and interface together is highlighted in the dendrogram (red). c Volcano plot of differentially expressed genes between the interface cluster versus the muscle and tumor clusters. p-values were obtained from the Wilcoxon’s rank sum test (two-sided). d Non-negative matrix factorization (NMF) of the microenvironment spots (muscle and interface clusters). Shown are the standardized factor scores for interface-specific NMF factor 7, projected onto microenvironment spots. Arrows denote areas with higher factor scores. e Enriched GO terms for the top 150 scoring genes in NMF factor 7.

Figure Data
Acknowledgments
This image is the copyrighted work of the attributed author or publisher, and ZFIN has permission only to display this image to its users. Additional permissions should be obtained from the applicable author or publisher of the image. Full text @ Nat. Commun.