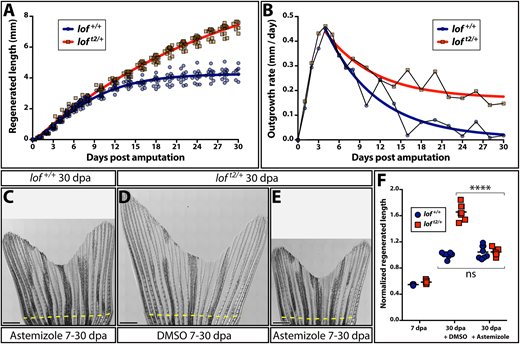
Fig. 3 Kcnh2a actively prolongs the fin outgrowth period in loft2. (A) Plots comparing the growth (A) and growth rate (B) of regenerating loft2/+ (blue) and clutchmate lof+/+ (red) caudal fins. Curves show actual data fit to (A) a logistic equation reflecting establishment and then progressively slowing outgrowth phases, and (B) an exponential decay equation using time points after the peak growth rate is reached. All data points (≥12 fish per time) are shown in A and mean values are used in B. (C-E) Stitched DIC images showing clutchmate lof+/+ astemizole-treated (C; 500 nM), DMSO-treated loft2/+ (D) and loft2/+, astemizole-treated (E; 500 nM) fish at 30 days post-caudal fin amputation (dpa). The dashed yellow line indicates the amputation plane. Scale bars: 1 mm. (F) Quantification of normalized caudal fin regenerative outgrowth from control and astemizole-treated animals. Data points represent individual lof+/+ (blue circles) and loft2/+ (red squares) animals prior to treatment (7 dpa) and post-treatment (30 dpa) with DMSO or astemizole (500 nM). Graph shows mean lengths of the third ventral regenerated ray normalized to DMSO-treated controls at 30 dpa. Each point is an individual animal. ****P<0.0001 for DMSO treated from 7-30 dpa compared with wild-type and loft2/+ fin lengths; no significant differences between genotypes at 7 dpa or when comparing 7-30 dpa astemizole-treated wild-type and loft2/+ regenerative outgrowth. Statistical tests used one-way ANOVA with Tukey's multiple comparisons tests.
Image
Figure Caption
Figure Data
Acknowledgments
This image is the copyrighted work of the attributed author or publisher, and
ZFIN has permission only to display this image to its users.
Additional permissions should be obtained from the applicable author or publisher of the image.
Full text @ Development

