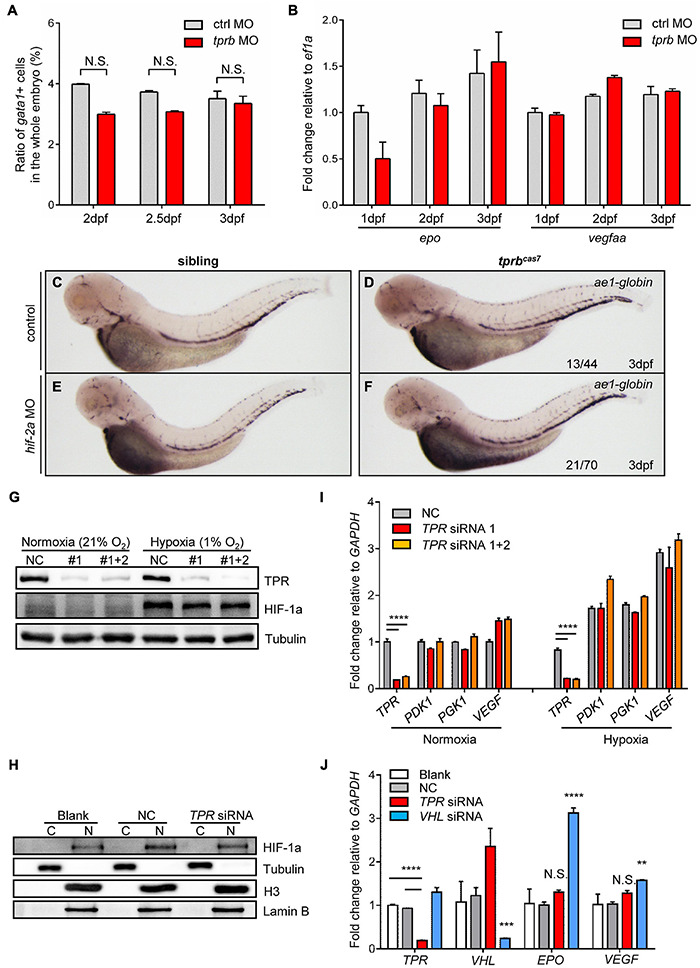
FIGURE 4
HIF signaling is not activated in tprbcas7 mutant. (A) The statistic results of the ratio of gata1+ cells sorted by flow cytometer in the whole embryo of control and tprb morphants by Tg(gata1: DsRed; kdrl: EGFP) transgenic line at different time points. (B) Quantitative PCR results of epo and vegfaa in control and tprb morphants at different time points. (C–F) WISH analysis of ae1-globin expression in sibling and tprbcas7 mutants at 3 dpf under the control and hif-2a morpholino (E,F) injection. (G) Immunoblotting analysis of TPR and HIF-1a protein level in whole HEK293T cells under normoxia and hypoxia conditions during TPR knockdown through siRNA. (H) Immunoblotting analysis of HIF-1a protein level in the nuclei of HEK293T cells under hypoxia condition after nuclear and cytoplasmic separation. C, cytoplasma; N, nucleus. (I) Quantitative PCR results of HIF target genes including TPR, PDK1, PGK1, and VEGF in HEK293T cells during TPR knockdown through siRNA. (J) Quantitative PCR results of HIF target genes including EPO and VEGF in Hep3B cells during TPR or VHL knockdown through siRNA under hypoxia condition. NC: negative control. #1: TPR siRNA 1; #1 + 2: TPR siRNA 1 + 2. Error bars represent SEM. N.S.: not significant; **p ≤ 0.01; ***p ≤ 0.001; ****p ≤ 0.0001.

