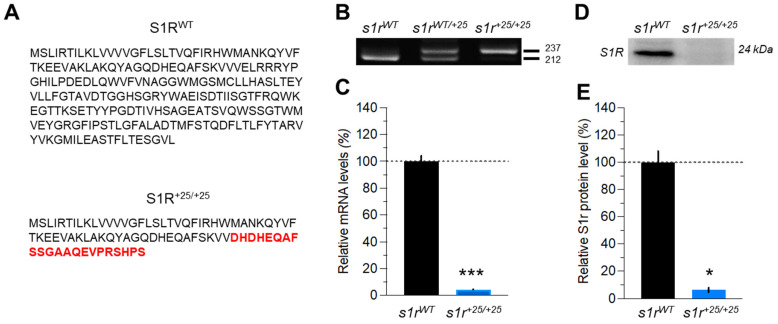
Figure 1 Characterization of the CRISPR/cas9-induced s1r mutant zebrafish line. (A) Amino acids sequence of the S1R protein with or without mutation. New inserted amino acids are depicted in red. (B) A targeted fragment was amplified by PCR from the genomic DNA of adult zebrafish tail and analyzed after migration on agarose gel. (C) Relative sigmar1 mRNA level revealed by qPCR in s1r+25/+25 and s1rWT zebrafish larvae. Expression of sigmar1 was normalized using the zef1α reference gene. (D) Representative Western blot of whole lysates from wild-type (s1rWT) or homozygous s1r+25/+25 mutant zebrafish. (E) Relative S1R protein level in the whole larvae at 5 dpf, normalized using total protein expression in the samples (Stain-Free™). Data are shown as the mean ± SEM from n = 12 per group in (C) and n = 4 in (E). * p < 0.05, *** p < 0.001 vs. s1rWT controls; Man n-Whitney’s test.
Image
Figure Caption
Figure Data
Acknowledgments
This image is the copyrighted work of the attributed author or publisher, and
ZFIN has permission only to display this image to its users.
Additional permissions should be obtained from the applicable author or publisher of the image.
Full text @ Int. J. Mol. Sci.

