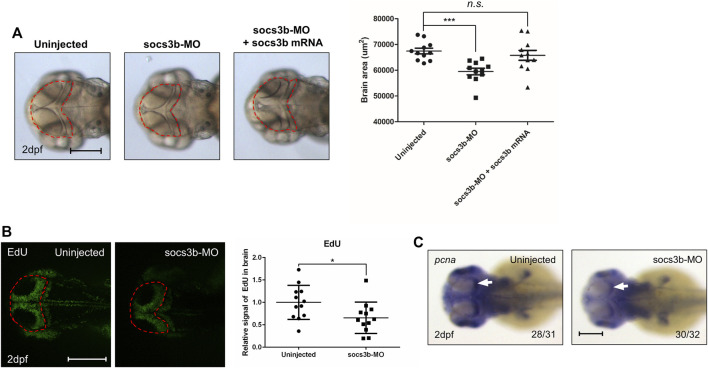
The zebrafish analogue socs3b governs brain development by regulating proliferation. (A) Representative images of A172 cells were obtained using a microscope fitted with a digital camera (scale bars, 300 µm). Different concentrations of DHE were added to the culture media of the glioblastoma A172 cells, and cell viability was measured using the MTT assay. (B) Dorsal view of live images with uninjected control embryos, socs3b-MO-injected embryos, and socs3b-MO- and socs3b-mRNA-co-injected embryos (left panel, red dotted lines indicate brain area), and quantified data of the brain area using ImageJ (right panel). (C) Dorsal view of confocal images after EdU staining with uninjected embryos and socs3b-MO-injected embryos (left panel, red dotted lines indicate brain area), and quantified intensity of EdU signals (right panel). (D) Dorsal view of WISH images using the cell proliferation marker pcna in uninjected embryos and socs3b-MO-injected embryos. Scale bars indicate 200 µm in each image (***p < 0.0001, *p < 0.05).
This image is the copyrighted work of the attributed author or publisher, and
ZFIN has permission only to display this image to its users.
Additional permissions should be obtained from the applicable author or publisher of the image.
Full text @ Front Genet
Your Input Welcome
Thank you for submitting comments. Your input has been emailed to ZFIN curators who may contact you if
additional information is required.
Oops. Something went wrong. Please try again later.