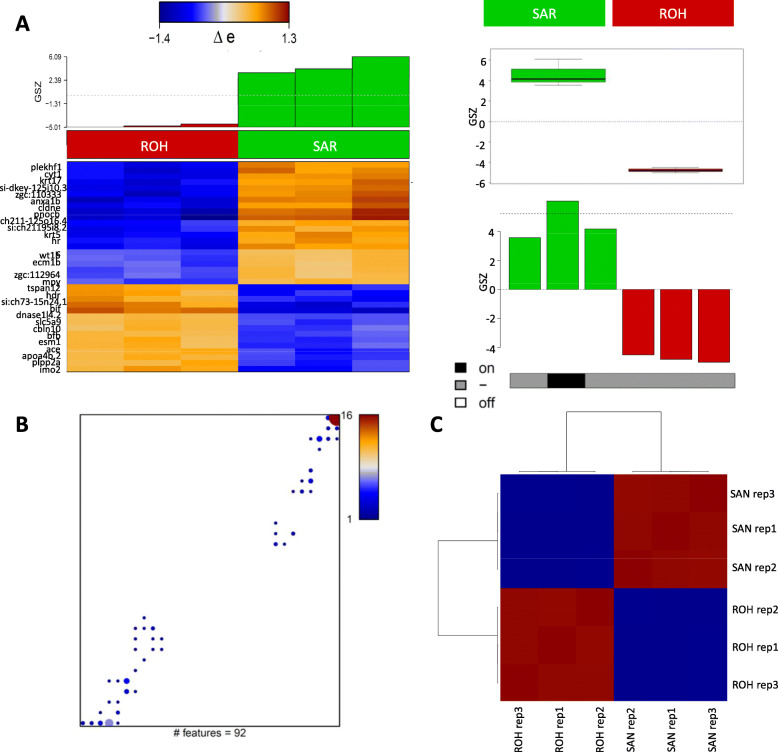
Fig. 4 Genes overexpressed in SAR and ROH. A Genes differentially expressed between SAR and ROH were identified based on FDR (false discovery rate) < 0.1 comprising 92 genes (51 + / 46 -) with p-values < 0.0001. The boxplot and barplot show average expression of those genes in the samples and in the cell populations, respectively. The heatmap shows 92 genes deviating more than one standard deviation from average expression. B Mapping of differentially expressed genes into the SOM grid: Number of genes in the metagenes is color-coded (maroon> red> blue) with white areas representing metagenes not containing any of the 92 DE genes (FDR < 0.1). C Pairwise Pearson’s correlation map between the replicates of SAR and ROH based on the 92 differential genes only. Contrast between the two cell populations is enhanced as expected (compare to Fig. 1E). Red color represents 3 samples of sinoatrial ring while blue color indicates 3 sample of rest of the heart. SAR; Sinoatrial ring, ROH; rest of the heart
Image
Figure Caption
Acknowledgments
This image is the copyrighted work of the attributed author or publisher, and
ZFIN has permission only to display this image to its users.
Additional permissions should be obtained from the applicable author or publisher of the image.
Full text @ BMC Genomics

