
|
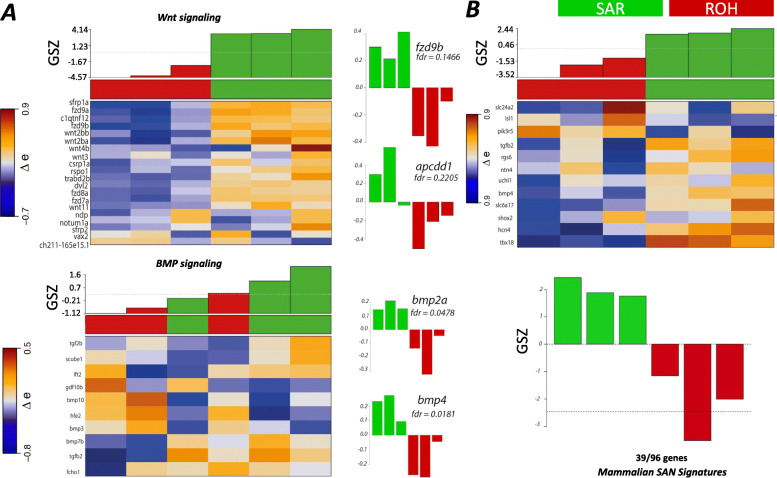
Fig. 3 Molecular signatures and signalling pathways of SAR correlate with those in the mammalian SAN. A Heatmap showing the expression of components of Wnt/β-catenin and BMP signalling genes reported in [30] in SAN and ROH. Histograms of expression of the some of the key genes in both pathways are shown to indicate a gene-specific difference in the two sample sets. B Heatmap showing the expression of mammalian SAN genes reported in Vedantham et al. (2015) that have been compared with our SAR and ROH data set. A total of 39 out of 96 genes among the mammalian signature genes were overexpressed in our dataset