IMAGE

Fig. 4

ID
ZDB-IMAGE-210925-4
Source
Figures for Linsley et al., 2021
Image
Figure Caption

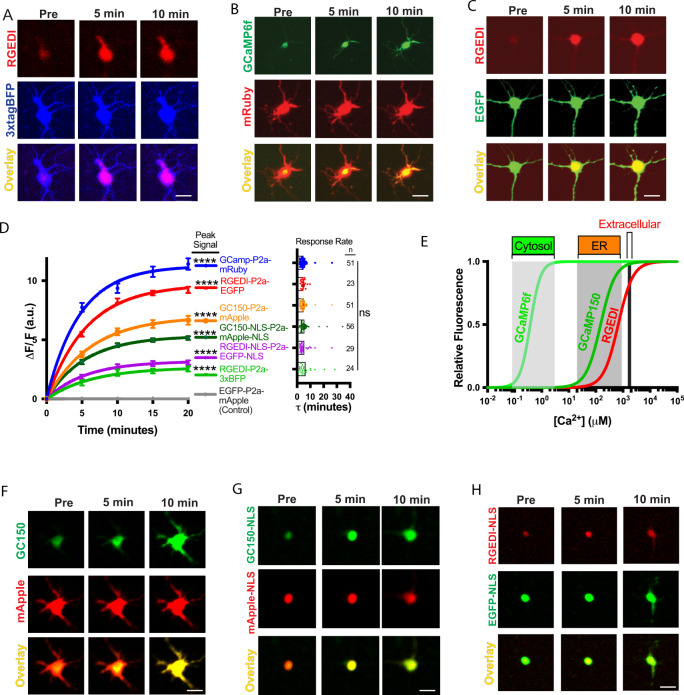
Fig. 4 Comparison of GEDI variants to detect neuronal death.

AC Representative images of rat primary cortical neurons expressing RGEDI-P2a-3xBFP (A), mRuby-P2a-GCaMP6f (B), or RGEDI-P2a-EGFP (C), before, 5 min and 10 min after exposure to NaN3. D Quantification of the peak signal and response rate of signal increase (τ) from fitted nonlinear regressions of increases in fluorescence signals over time from variants of the GEDI biosensor: RGEDI-P2a-3xBFP (n = 23), mRuby-P2a-GCaMP6f (n = 52), RGEDI-P2a-EGFP (n = 41), GC150-P2a-mApple, RGEDI-NLS-P2a-EGFP-NLS, and GC150-NLS-P2a-mApple-NLS (n = 40), compared to EGFP-P2a-mApple (n = 18). Error bars represent SE, ANOVA Tukey’s ****p < 0.0001; ns not significant, n values represent individual neurons sampled across at least three independent wells. E Relative fluorescence of GECI’s GCaMP6f79 and RCEPIA36/RGEDI and GCaMP150ER37/GC150 across Ca2+ concentrations modeled from previously reported Hill coefficients and Kd values. F Representative images of rat primary cortical neurons expressing GC150-P2a-mApple, G GC150-NLS-P2a-mApple-NLS, and H RGEDI-NLS-P2a-EGFP-NLS before, 5 min, and 10 min after exposure to NaN3. Error bars represent SEM. Scale = 25 μm. Experiments in AC and FH were repeated at least 18 times with similar results.

Acknowledgments
This image is the copyrighted work of the attributed author or publisher, and ZFIN has permission only to display this image to its users. Additional permissions should be obtained from the applicable author or publisher of the image. Full text @ Nat. Commun.