
|
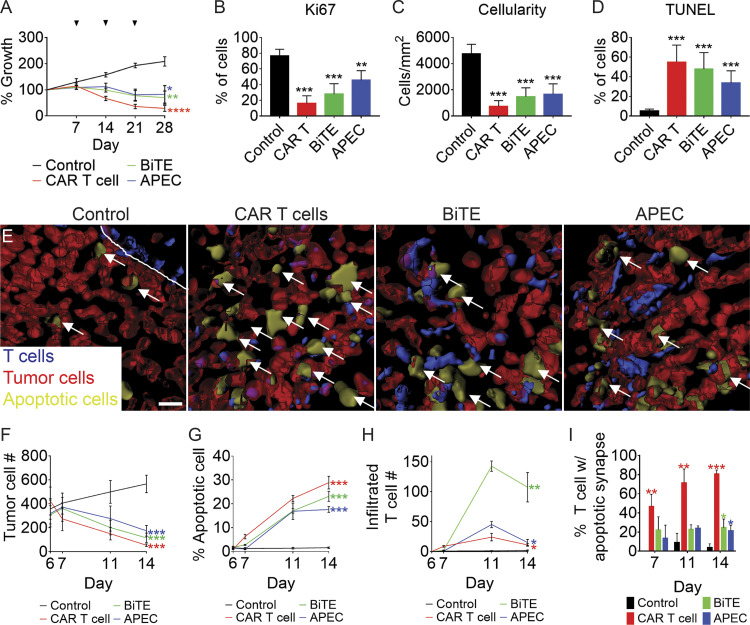
Figure 7.
EGFR-specific T cell immunotherapies for the treatment of RMS. (A–D) rag2Δ/Δ, il2rga−/− animals engrafted by IP injection with EGFP+ RD cells and then coadministered weekly (i) control EGFR antibody along with CD8+ T cells, (ii) EGFR CAR T cells, (iii) EGFR/CD3 BiTE with CD8+ T cells, or (iv) EGFR-M14C with CMV-specific CD8+ T cells. Relative growth assessed by whole animal imaging with dosing noted by arrowheads (A). Quantification of proliferation by Ki67 IHC (B), cellularity based on H&E staining (C), and cell apoptosis by TUNEL (D) at 28 dpt. n = 3 animals/condition (B–D). (E–I) 3D modeling of T cell immunotherapy responses in animals engrafted with mCherry+/ZipGFP-Casp3+ RD cells into the periocular muscle imaged at 11 dpt. Control treated T cells (left, E) and T cell immunotherapy (right panels, E). Arrows denote representative examples of apoptotic tumor cells. Quantitation of therapy effects on tumor cell number (F; growth), tumor cell apoptosis (G), T cells infiltrated into tumor mass (H), and percentage of T cells in contact with apoptotic tumor cells (I). n = 5 animals/condition (A and F–I). *, P < 0.05; **, P < 0.01; ***, P < 0.001; ****, P < 0.0001, Student’s t test. Scale bar equals 10 µm (E). Error bars denote ±SD (A–D and F–I).