Figure 6
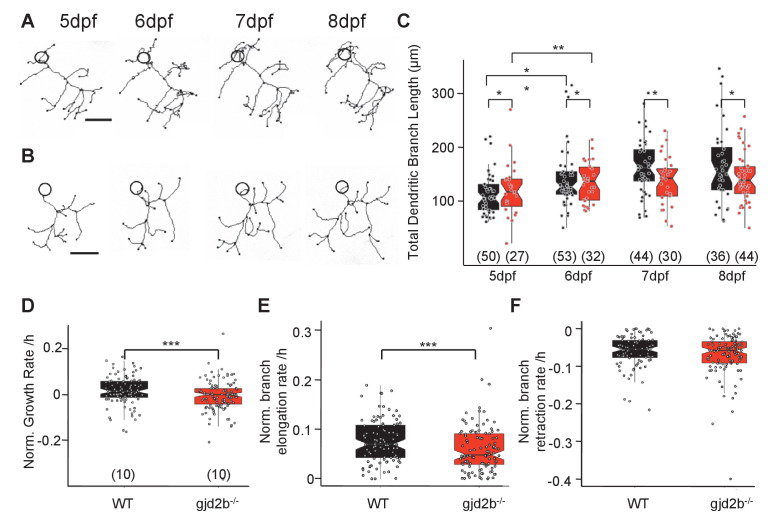
(A) Representative traces of a wild-type (WT) PN from 5 to 8 days post fertilization (dpf). (B) Representative traces of a gjd2b-/- mutant PN from 5 to 8 dpf; scale bar is 10 µm; circle represents the position of the soma and is not to scale. (C) Total dendritic branch length (TDBL) of WT (black) and gjd2b-/- (red) PNs from 5 to 8 dpf. WT and gjd2b-/- neurons show significant growth from 5 to 6 dpf (p=0.0021). WT neurons show significantly higher TDBL values at all days (p=0.048). Statistical comparison was done using a general linear model with an inverse Gaussian error distribution. Post-hoc comparisons were done with the emmeans package in R. (D) Average rate of normalized hourly net branch growth in WT and gjd2b-/- PNs at 6 dpf. Mutant neurons show a significantly reduced rate over 10 hr of observation (p=0.005). (E) Rate of branch elongation in WT and mutant PNs at 6 dpf. Mutant PNs show a significantly reduced rate of branch length elongations (p=0.022). (F) Rate of branch length retractions in WT and mutant PNs at 6 dpf. No significant difference is observed between the two groups (p=0.185). Statistical comparisons in (D–F) were done using general linear models with Gaussian error distribution. Ns (number of neurons sampled) are indicated in parentheses in (C–E). See also Figure 6—figure supplement 1. Data used for quantitative analyses are available in Figure 6—source data 1.
Dendritic arbor growth of gjd2b-/-Purkinje neurons (PNs) is impaired.
Image
Figure Caption
Figure Data
Acknowledgments
This image is the copyrighted work of the attributed author or publisher, and
ZFIN has permission only to display this image to its users.
Additional permissions should be obtained from the applicable author or publisher of the image.
Full text @ Elife

