IMAGE

Figure EV1

ID
ZDB-IMAGE-210714-41
Source
Figures for Jamalpoor et al., 2021
Image
Figure Caption

Figure EV1 Generation of <italic>CTNS</italic><sup>−/−</sup> isogenic cell line of ciPTEC using CRISPR

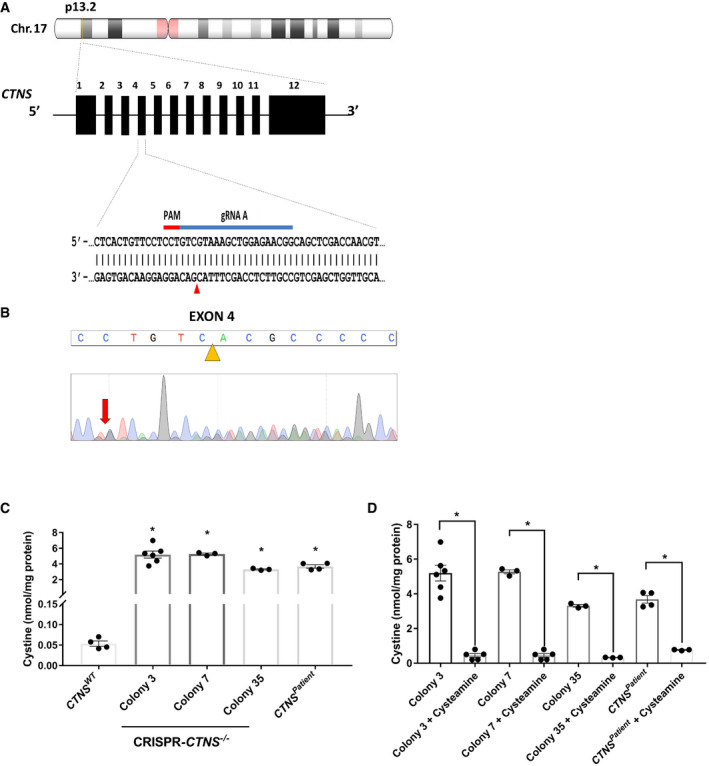
Schematic overview of the CRISPR‐based strategy to knockout the CTNS gene in ciPTEC.

Sanger sequencing chromatogram shows resulting sequence in CRISPR‐generated cystinotic cells (CTNS−/−).

Quantification of cystine levels (nmol/mg protein) by HPLC‐MS/MS in control (CTNSWT), CRISPR‐generated cystinotic cells (CTNS−/−; line 3, 7 and 35, and patient‐derived cystinotic cells (CTNSPatient) (n = 3–6).

Quantification of cystine levels (nmol/mg protein) by HPLC‐MS/MS in CTNS−/− lines (3, 7 and 35), and CTNSPatient cells upon treatment with cysteamine (100 µM) (n = 3–6).

Data information: Data are expressed as mean ± SEM. *P‐values < 0.05 were considered to be significant. One‐way ANOVA with Dunnett’s correction (C and D) or unpaired t‐test (D). Exact P‐values and statistical tests are listed in Appendix Table S1.

Acknowledgments
This image is the copyrighted work of the attributed author or publisher, and ZFIN has permission only to display this image to its users. Additional permissions should be obtained from the applicable author or publisher of the image. Full text @ EMBO Mol. Med.