
Image
|
Figure Caption
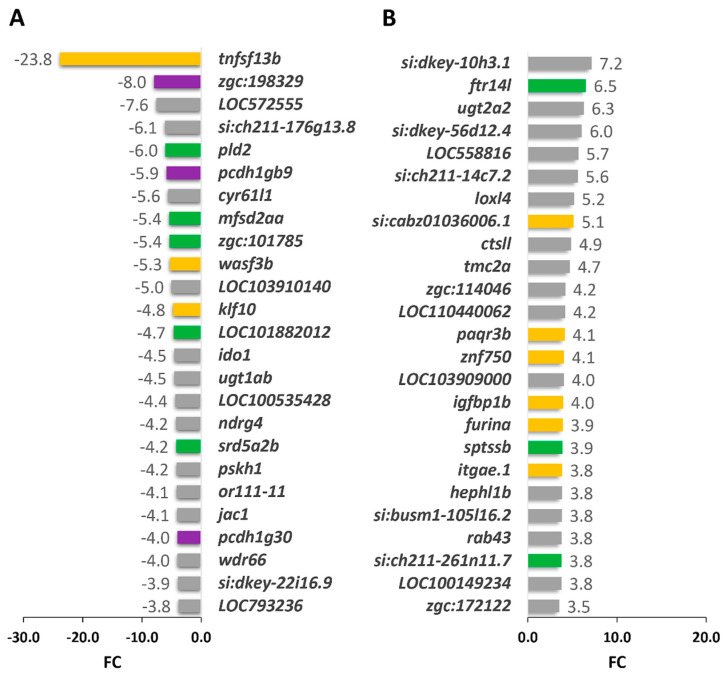
Figure 7 Top 25 DEGS in cyp1b1-KO vs. wildtype seven-dpf zebrafish larvae. (A) Down- and (B) upregulated genes identified by high-throughput RNA sequencing with significant differences in the comparison. Yellow bars: development signaling genes. Green bars: lipid metabolism genes. Purple bars: extracellular matrix and cell adhesion genes. Grey: down- and upregulated genes from other functional pathways.
Acknowledgments
This image is the copyrighted work of the attributed author or publisher, and
ZFIN has permission only to display this image to its users.
Additional permissions should be obtained from the applicable author or publisher of the image.
Full text @ Int. J. Mol. Sci.