
|
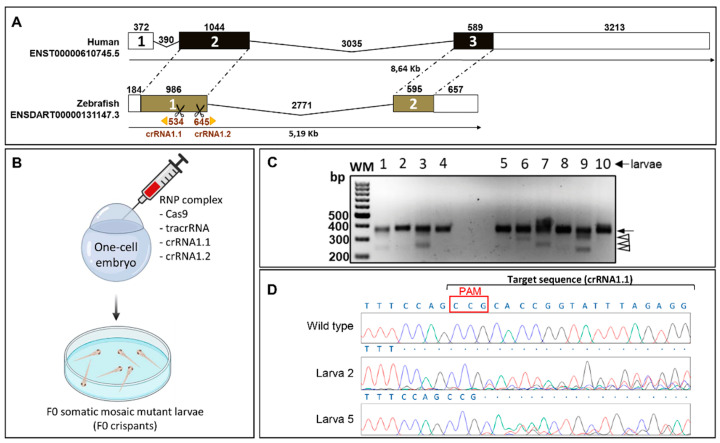
Figure 1 CYP1B1 gene structure and generation of the zebrafish cyp1b1 FO by CRISPR/Cas9 genome editing. (A) Comparison of exon and intron organization of human and zebrafish CYP1B1 genes. The numbers above boxes and black lines represent the length in bp of exons and introns, respectively. Untranslated regions are represented by white boxes and coding regions are represented by black and brown boxes. Dotted lines represent conserved exons. The Ensembl region comparison tool was used to obtain the scheme. Scissors indicate the position of the two CRISPR guides used to generate cyp1b1-KO (crRNA1.1 and crRNA1.2). (B) Obtention of F0 somatic mosaic mutant larvae by the RNP complex (Cas9 protein/tracrRNA/crRNA 1.1/crRNA 1.2) microinjection of one-cell embryos (F0 somatic mosaic crispants, n = 215). The two crRNAs were injected simultaneously to generate cyp1b1 deletions. The scheme was created with the Biorender tool (https://biorender.com/) (accessed on 21 April 2021). (C) Analysis of the CRISPR/Cas9 efficiency by agarose electrophoresis of cyp1b1 exon 1 PCR products amplified from 10 F0 larvae (48 hpf). Black arrow: main PCR product. Arrowheads: different exon 1 deletions. (D) Sanger sequencing of the main band (arrow) detected in (C). The electropherograms of two larvae (2 and 5) are shown as representative results of this analysis. Overlapping peaks indicate the presence of different mutations. Red box: protospacer adjacent motif (PAM) site.