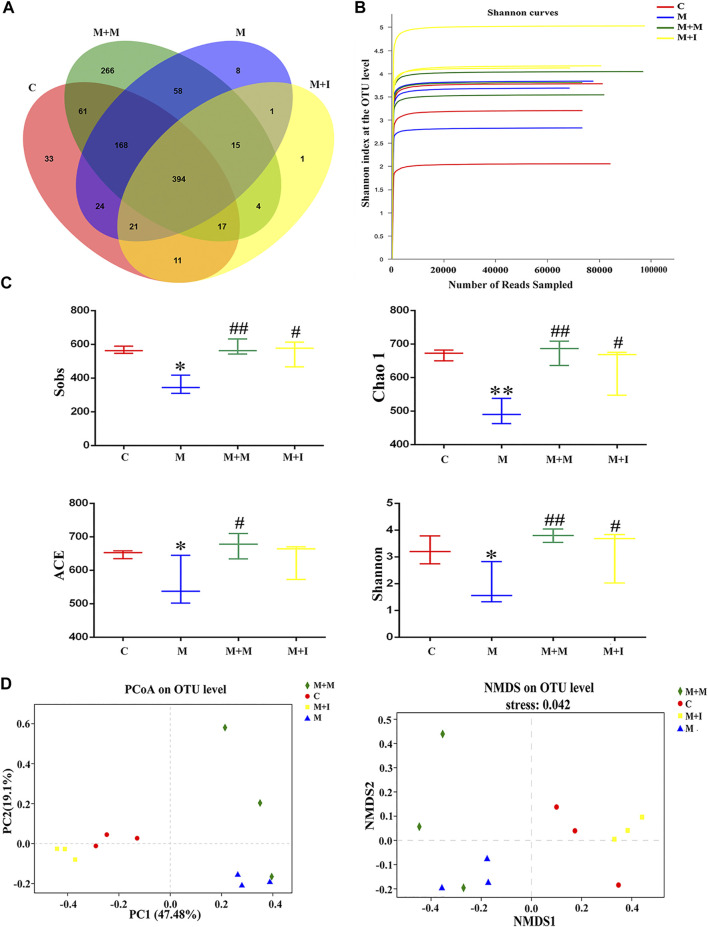
Comparison of community structure among the fecal microbiota of the C, M, M + M, and M + I groups. (A) Venn diagram illustrating the overlap of the operational taxonomic units (OTUs) identified in the fecal microbiota of the four groups. (B) Shannon curves among the four groups. (C) Alpha diversity of the fecal microbiome among the four groups according to Sobs, Chao, ACE, and Shannon indices. (D) Beta diversity of the fecal microbiome among the four groups based on principal coordinate analysis (PCoA) and nonmetric multidimensional scaling (NMDS). *p < 0.05, **p < 0.01 vs the C group; #p < 0.05, ##p < 0.01 vs the M group. C: control group; M: morphine group; M + M: morphine + methadone group; M + I: morphine + isorhynchophylline group.
Acknowledgments
This image is the copyrighted work of the attributed author or publisher, and
ZFIN has permission only to display this image to its users.
Additional permissions should be obtained from the applicable author or publisher of the image.
Full text @ Front Pharmacol
Your Input Welcome
Thank you for submitting comments. Your input has been emailed to ZFIN curators who may contact you if
additional information is required.
Oops. Something went wrong. Please try again later.