
Image
|
Figure Caption
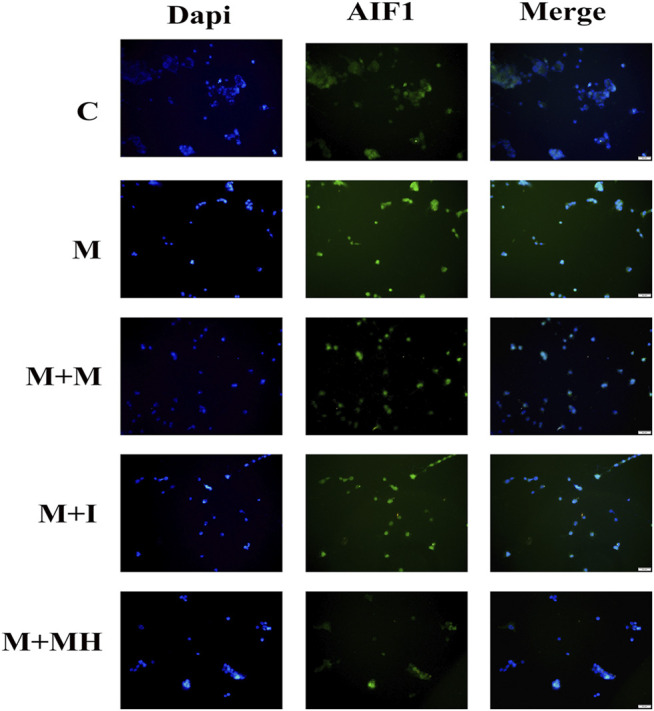
FIGURE 2
Cells were subjected to immunofluorescence analysis using an antibody directed against AIF1 (green). Nuclei were counterstained with DAPI (blue). The fluorescence was visualized and imaged under a fluorescence microscope. C: control group; M: morphine group; M + M: morphine+methadone group; M + I: morphine+isorhynchophylline; M + MH: morphine+minocycline hydrochloride.
Acknowledgments
This image is the copyrighted work of the attributed author or publisher, and
ZFIN has permission only to display this image to its users.
Additional permissions should be obtained from the applicable author or publisher of the image.
Full text @ Front Pharmacol