
Image
|
Figure Caption
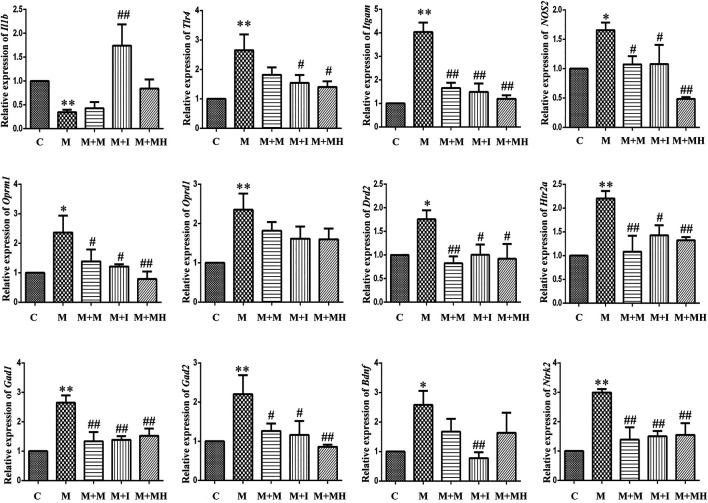
FIGURE 3 qPCR analysis of Il1b, Tlr4, Itgam, Nos2, Oprm1, Oprd1, Drd2, Htr2a, Gad1, Gad2, Bdnf, and Ntrk2 expression in BV2 cells (n = 3). *p < 0.05, **p < 0.01 vs the C group; #p < 0.05, ##p < 0.01 vs the M group. C: control group; M: morphine group; M + M: morphine + methadone group; M + I: morphine + isorhynchophylline group; M + MH: morphine + minocycline hydrochloride group.
Acknowledgments
This image is the copyrighted work of the attributed author or publisher, and
ZFIN has permission only to display this image to its users.
Additional permissions should be obtained from the applicable author or publisher of the image.
Full text @ Front Pharmacol