IMAGE

Figure 1 supplement 4

ID
ZDB-IMAGE-210625-19
Genes
Source
Figures for Gentile et al., 2021
Image
Figure Caption

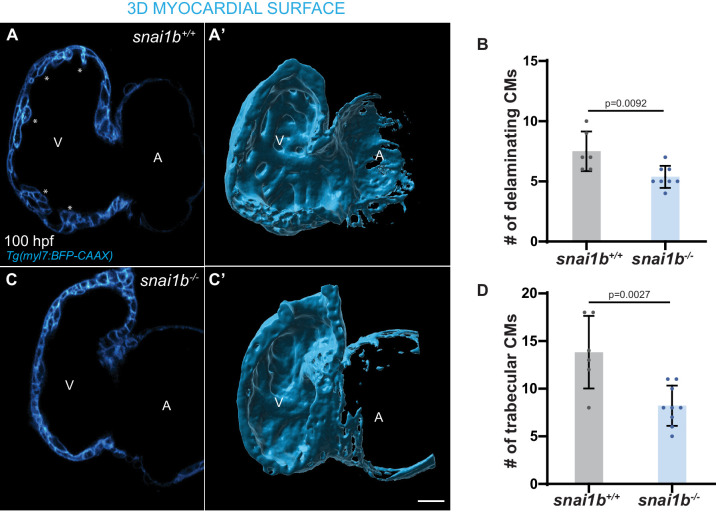
Figure 1 supplement 4 <italic toggle='yes'>snai1b</italic> mutants exhibit reduced cardiac trabeculation.

(A–C’) Single-plane images and inner 3D surface rendering of trabecular cardiomyocytes (CMs) (asterisks in A) in 100 hpf snai1-/- (C, C’) and snai1b+/+ (A, A’) larvae. (B–D) Fewer delaminating (B) and trabecular (D) CMs are observed in snai1b-/- larvae compared with snai1b+/+ larvae at 78 (snai1b+/+, n = 6; snai1b-/-, n = 8) and 100 (snai1b+/+, n = 6; snai1b-/-, n = 9) hpf. Plot values represent means ± S.D.; p-values determined by Student’s t-test. Scale bars: 20 µm. V: ventricle; A: atrium; n: number of embryos.

Figure Data
Acknowledgments
This image is the copyrighted work of the attributed author or publisher, and ZFIN has permission only to display this image to its users. Additional permissions should be obtained from the applicable author or publisher of the image. Full text @ Elife