IMAGE

FIGURE 2

ID
ZDB-IMAGE-210623-25
Genes
Source
Figures for Lu et al., 2021
Image
Figure Caption

FIGURE 2

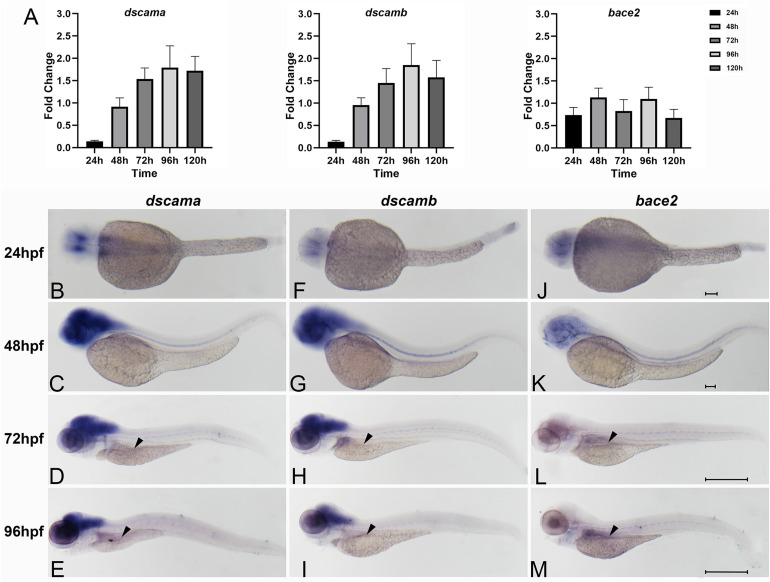
Spatiotemporal expression of zebrafish of dscama, dscamb, and bace2 during early embryogenesis. (A) qRT-PCR analysis of relative expression levels of dscama, dscamb, and bace2 in zebrafish embryos from 24 to 120 hpf. (B–M) Whole-mount in situ hybridization in wild-type embryos for dscama(B–E), dscamb(F–I), and bace2(J–M). Strong expression of dscama(B–E) and dscamb(F–I) was observed in the brain and central nervous system after 24 hpf, and a weakly positive expression signal was observed in the intestinal bulb at 72 and 96 hpf (black arrowheads). (J–K)bace2 expression in the neural crest cells and pigment epithelial cells of the retina at 24 and 48 hpf. A relatively strong expression signal of bace2 was observed in the intestinal primordium after 72 hpf indicated by black arrowheads (L,M). Scale bar for 24 and 48-hpf embryos is 100 μm, and that for 72 and 96-hpf embryos is 500 μm.

Figure Data
Acknowledgments
This image is the copyrighted work of the attributed author or publisher, and ZFIN has permission only to display this image to its users. Additional permissions should be obtained from the applicable author or publisher of the image. Full text @ Front Cell Dev Biol