IMAGE

FIGURE 5

ID
ZDB-IMAGE-210623-16
Source
Figures for Lu et al., 2021
Image
Figure Caption

FIGURE 5

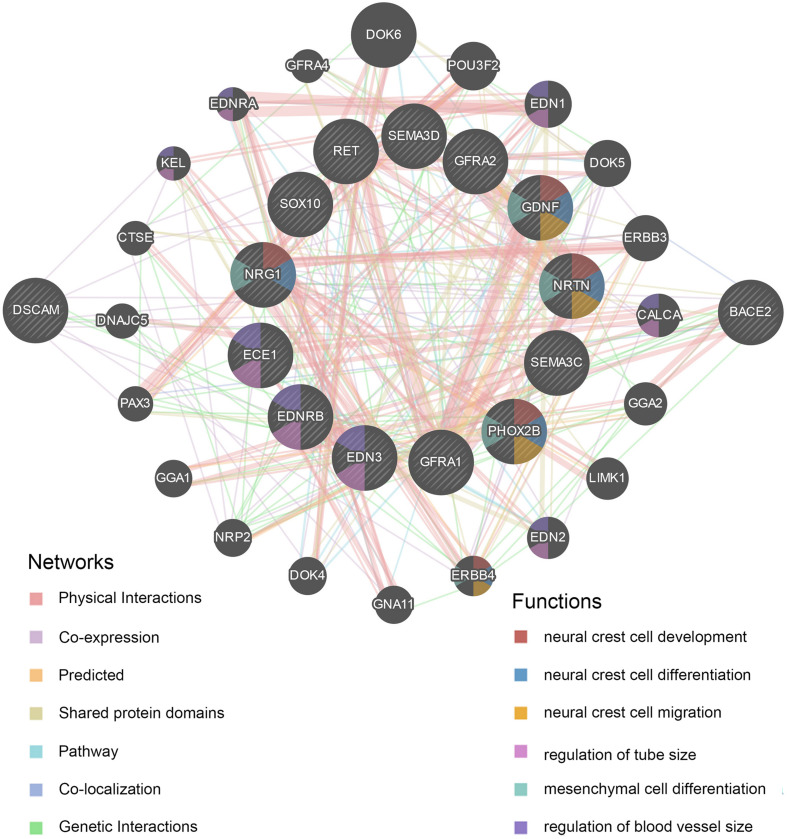
Protein–protein interaction (PPI) network of DSCAM and BACE2. The plot was constructed on GeneMANIA website. The correlations of DSCAM and BACE2 with critical signaling pathway genes were illustrated. The 13 central nodes represent the critical susceptibility genes of HSCR. The surrounded 20 nodes represent genes highly relevant to the central nodes in terms of physical interaction, co-expression, prediction, pathway, co-localization, genetic interactions, and shared protein domains. The color of connecting lines between nodes represents the type of protein–protein interaction (PPI). The color of the node represents the possible functions of the genes.

Acknowledgments
This image is the copyrighted work of the attributed author or publisher, and ZFIN has permission only to display this image to its users. Additional permissions should be obtained from the applicable author or publisher of the image. Full text @ Front Cell Dev Biol