IMAGE

Fig. 6

ID
ZDB-IMAGE-210612-25
Genes
Source
Figures for Cunningham et al., 2021
Image
Figure Caption

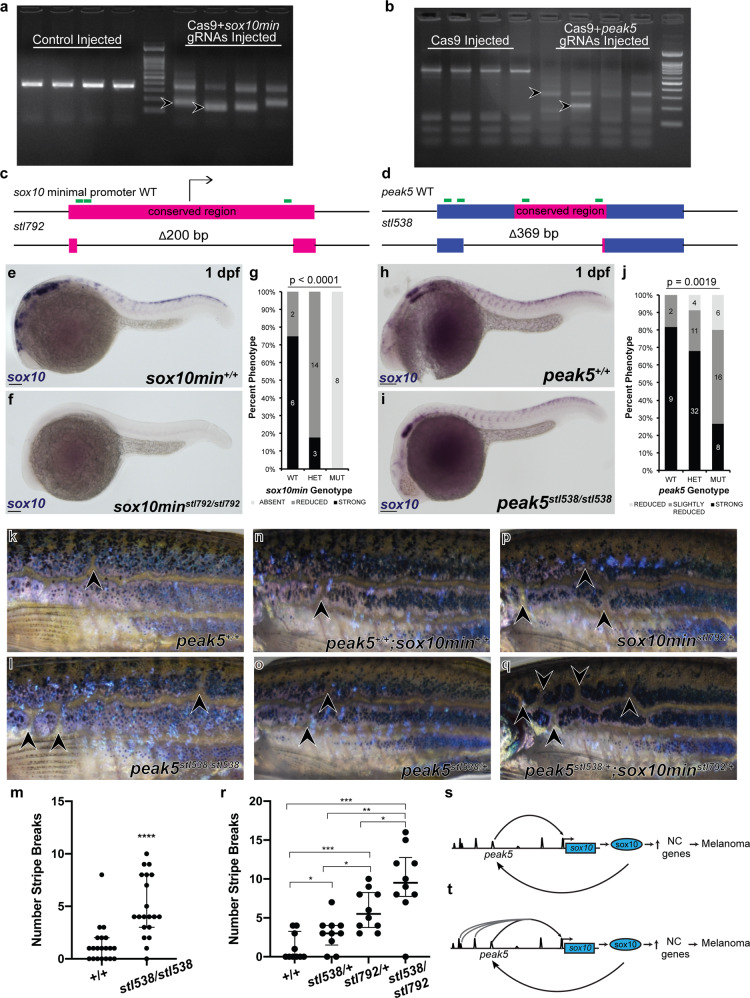
Fig. 6 In vivo CRISPR/Cas9 deletion of <italic>peak5</italic> affects <italic>sox10</italic> expression and adult stripe patterning.

a 1 dpf CRISPR/Cas9 injected embryos with sgRNAs targeting the sox10 minimal promoter show DNA laddering (arrowheads) as compared to control injected embryos. b CRISPR/Cas9 injected embryos with sgRNAs targeting peak5 show complete disruption of the wild-type locus as evidenced by DNA laddering (arrowheads) compared to Cas9 injected embryo. c The stl792 allele contains a 200 bp deletion at the sox10 minimal promoter locus, which contains the TSS of sox10. d The stl538 allele contains 369 bp deletion at the peak5 locus, mainly disrupting the conserved region of peak5. e WISH for sox10 mRNA shows robust expression in wild-type 1 dpf embryos and f absent expression in stl729 homozygous mutant 1 dpf embryos. g Quantification of WISH expressing the percent of embryos displaying either “strong, “reduced,” or “absent” sox10 expression. p < 0.0001, Fisher’s exact test. h WISH for sox10 mRNA shows robust expression in wild-type 1 dpf embryos and i reduced expression in stl538 homozygous mutant 1 dpf embryos. j Quantification of WISH expressing the percent of embryos displaying either “strong, “reduced,” or “strongly reduced” sox10 expression. p = 0.0019, Fisher’s exact test. k Lateral view of one side of a wild-type Tg(BRAFV600E);p53−/ adult fish with 1 stripe break (arrowhead) compared to l a stl538 homozygous adult fish with 3 stripe breaks (arrowheads). m Quantification of the number of stripe breaks per fish. Each dot represents one fish. Wild-type fish exhibit a median of 1 stripe break per fish, IQR 0–2. stl538 homozygous fish exhibit a median of 4 stripe breaks per fish, IQR 3–8. *****p < 0.0001, Welch’s t-test. n Lateral view of one side of a wild-type Tg(BRAFV600E);p53−/− adult fish with 1 stripe break (arrowhead) compared to o a peak5stl538 heterozygote with two stripe breaks (arrowheads), p a sox10minstl792 heterozygote with 3 stripe breaks (arrowheads) and q a peak5stl538;sox10minstl792 trans-heterozygote with 5 stripe breaks (arrowheads). r Quantification of the number of stripe breaks per fish. Each dot represents one fish. Wild-type fish exhibit a median of 0 stripe breaks, IQR 0–3.25. peak5stl538 heterozygotes exhibit a median of 3 stripe breaks, IQR 1.5–4. sox10minstl792 heterozygotes exhibit a median of 5.5 stripe breaks per fish, IQR 3.75–8.25. peak5stl538/+;sox10minstl792/+ trans-heterozygotes exhibit a median of 9.5 stripe breaks per fish, IQR 7.75–12.75. *p < 0.05, **p = 0.001, ***p < 0.0002, Welch’s t-test. s In our model, peak5 activates sox10 expression in NCCs during development and then again in melanoma precursor cells, likely through dimeric SoxE TFBS. This leads to upregulation of neural crest-related genes and melanoma onset. tpeak5 is most likely not the only sox10 enhancer that regulates sox10 expression. Multiple elements within the sox10 super-enhancer may coordinate together to upregulate sox10 expression during melanoma initiation.

Figure Data
Acknowledgments
This image is the copyrighted work of the attributed author or publisher, and ZFIN has permission only to display this image to its users. Additional permissions should be obtained from the applicable author or publisher of the image. Full text @ Commun Biol