IMAGE

Fig. 3

ID
ZDB-IMAGE-210612-22
Genes
Source
Figures for Cunningham et al., 2021
Image
Figure Caption

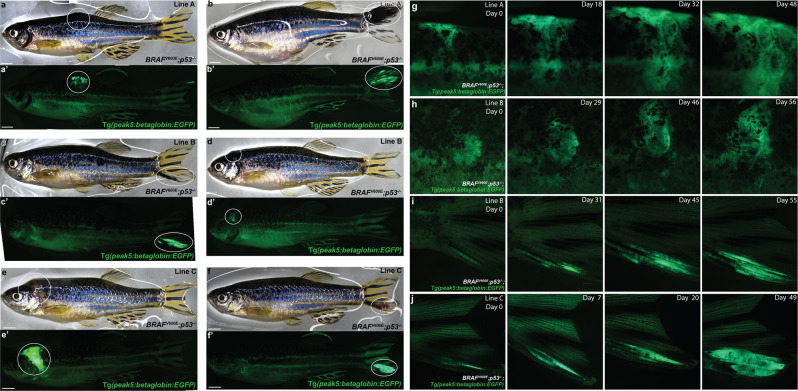
Fig. 3 <italic>peak5</italic> is active in melanoma tumors across multiple stable lines and in melanoma precursor lesions.

a, b Bright-field images of tumors, circled, in Tg(peak5:betaglobin:EGFP) stable line A in the Tg(BRAFV600E);p53−/− zebrafish background. a′, b′ Tumors are EGFP positive and EGFP is highly expressed in tumors compared to any low EGFP expression elsewhere in the fish. c, d Bright-field images of Tg(peak5:betaglobin:EGFP) stable line B with tumors, circled. c′, d′ Tumors are EGFP positive. e, f Bright-field images of Tg(peak5:betaglobin:EGFP) stable line C with tumors, circled. e′, f′ Tumors are EGFP positive. gTg(peak5:betaglobin:EGFP) stable line A zebrafish with dorsally located melanoma precursor lesion that grows over time. hTg(peak5:betaglobin:EGFP) stable line B zebrafish with a melanoma precursor lesion in a scale that expands in size over time. iTg(peak5:betaglobin:EGFP) stable line B zebrafish with precursor lesion located on the tail that grows over time. jTg(peak5:betaglobin:EGFP) stable line C zebrafish with a precursor lesion on the tail that grows into a tumor. Day 0 denotes the first day the precursor lesion was observed.

Figure Data
Acknowledgments
This image is the copyrighted work of the attributed author or publisher, and ZFIN has permission only to display this image to its users. Additional permissions should be obtained from the applicable author or publisher of the image. Full text @ Commun Biol