
Image
|
Figure Caption
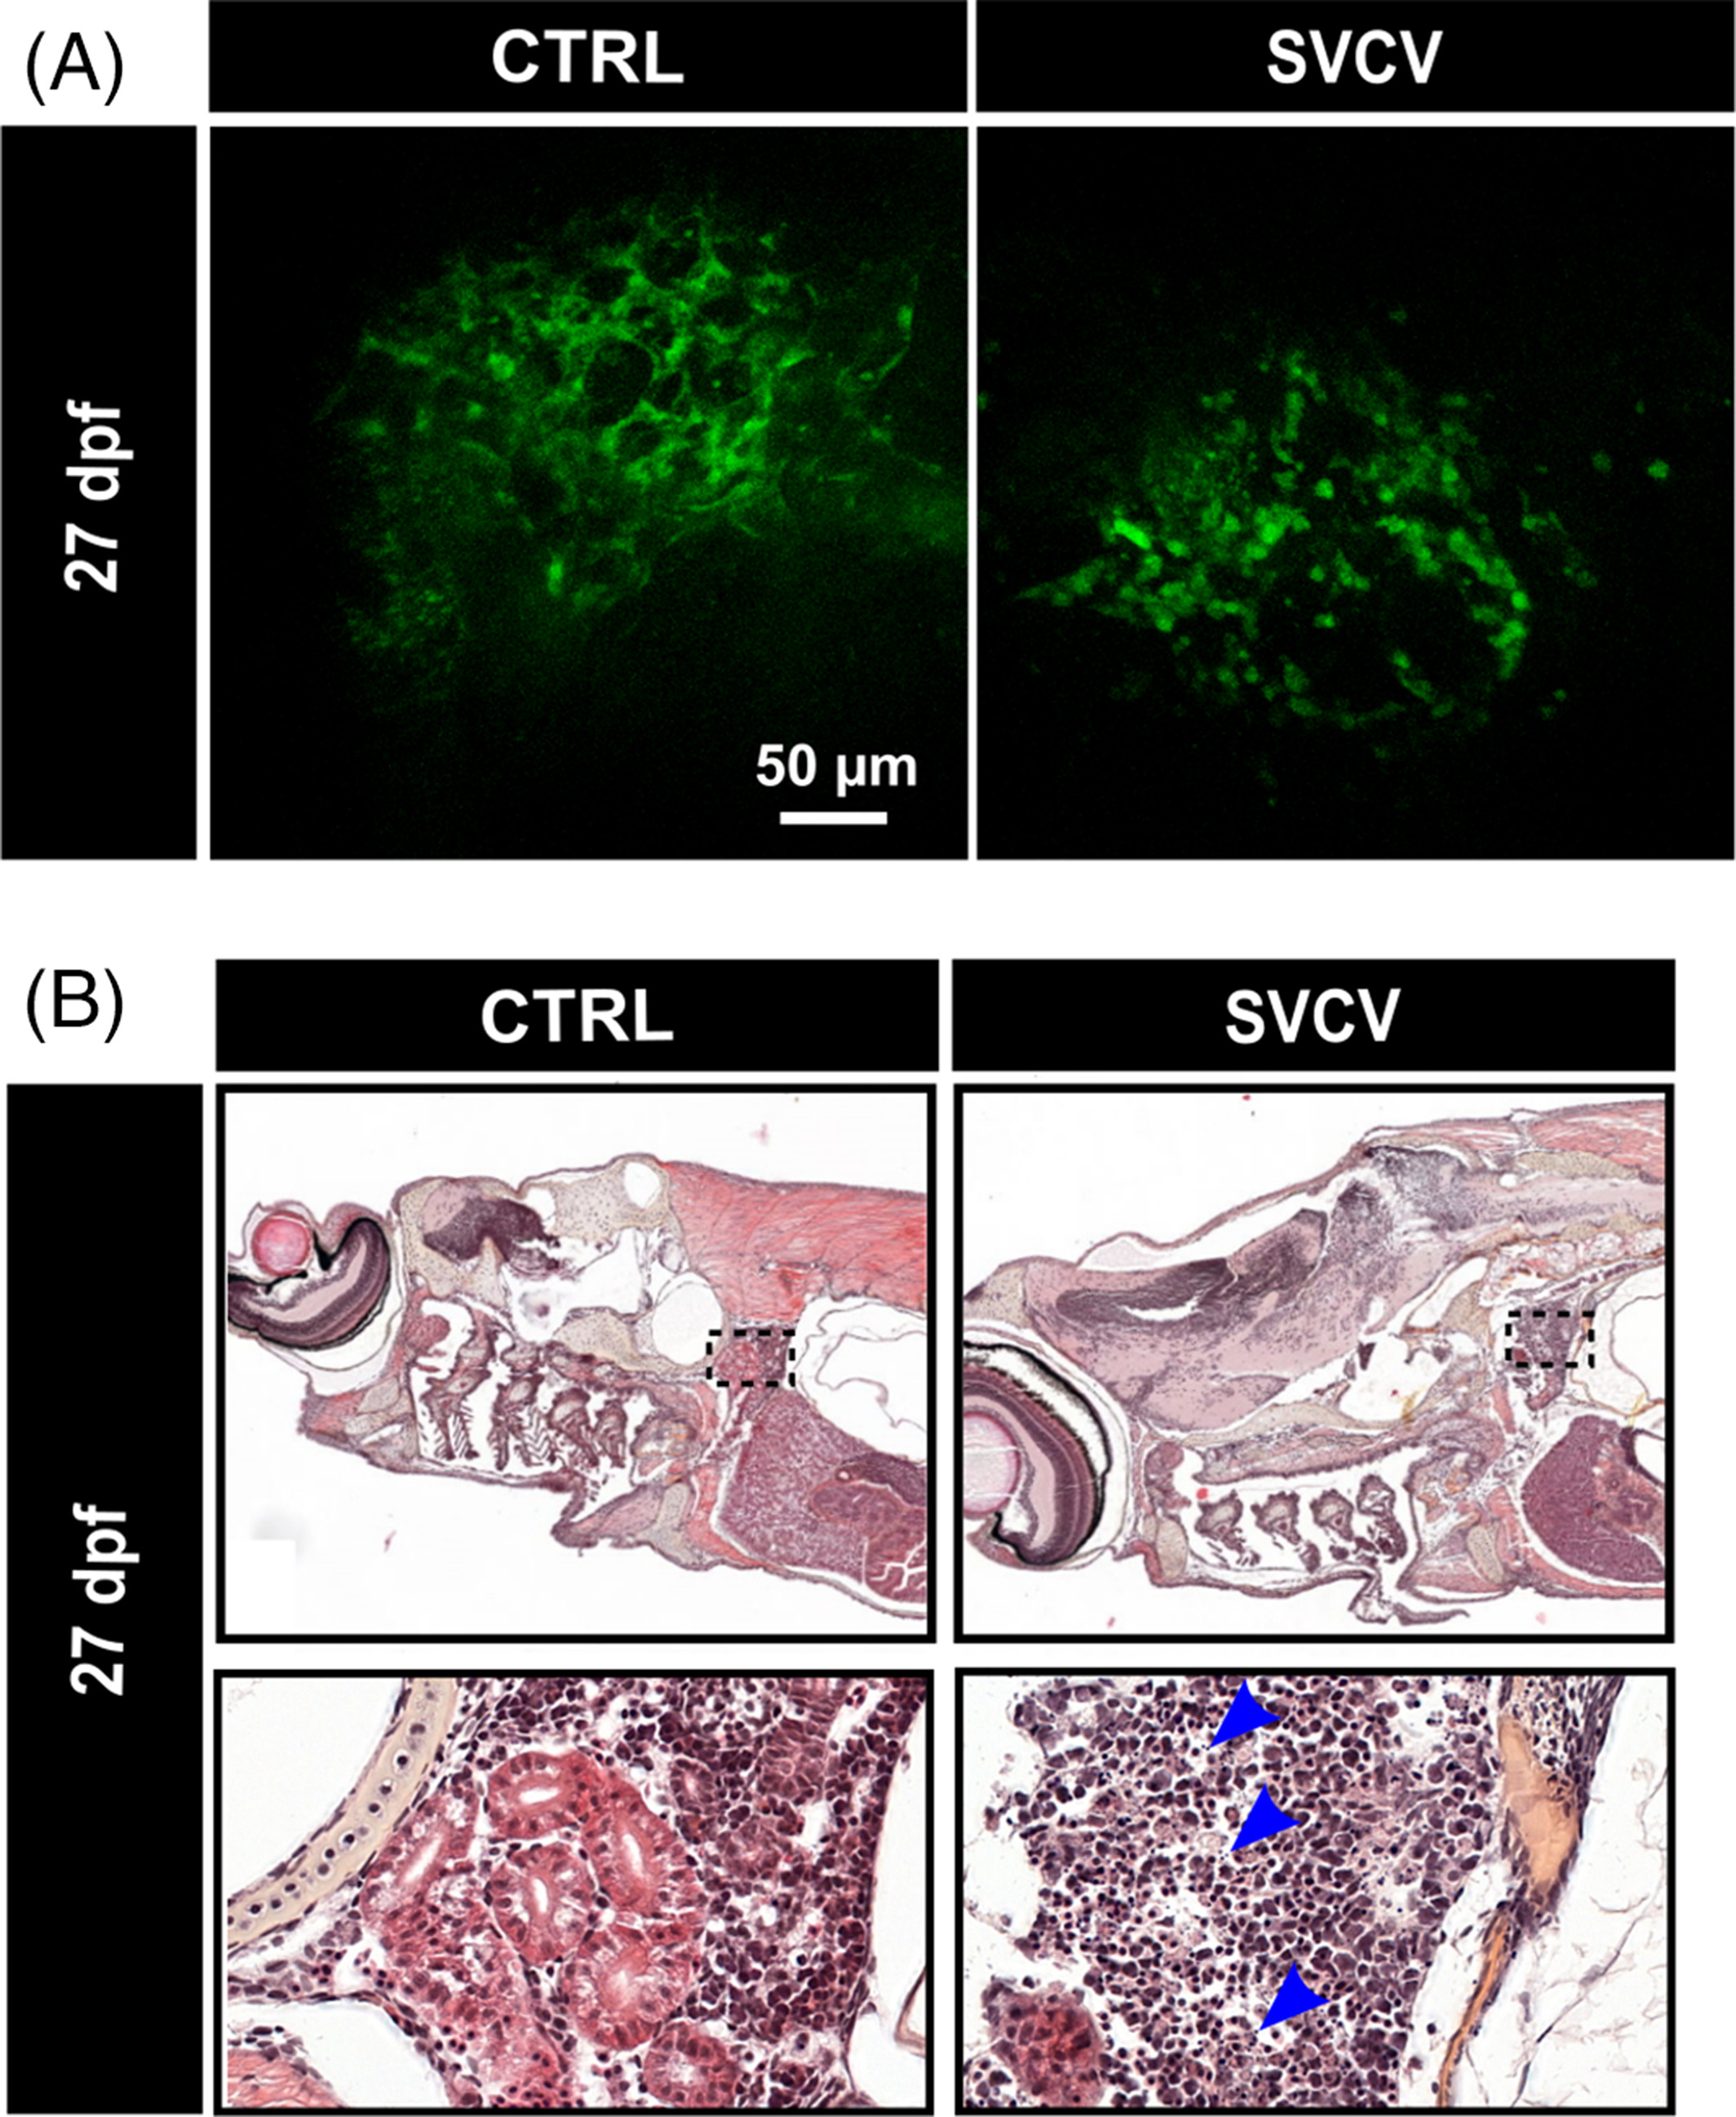
Fig. 7 SVCV infection disrupts the renal batf3MIN network. A, Maximum projection of in vivo images of Tg(batf3MIN:eGFP) head kidney upon SVCV infection (SVCV) or in control conditions (CTRL). B, Hematoxylin and eosin stain of histological sections from SVCV infected fish (SVCV) and controlled fish (CTRL) performed 24 hpi. Black dashed boxes indicate the region of the kidney presented in the lower panels. Blue arrowheads show cell death
Acknowledgments
This image is the copyrighted work of the attributed author or publisher, and
ZFIN has permission only to display this image to its users.
Additional permissions should be obtained from the applicable author or publisher of the image.
Full text @ Dev. Dyn.