
|
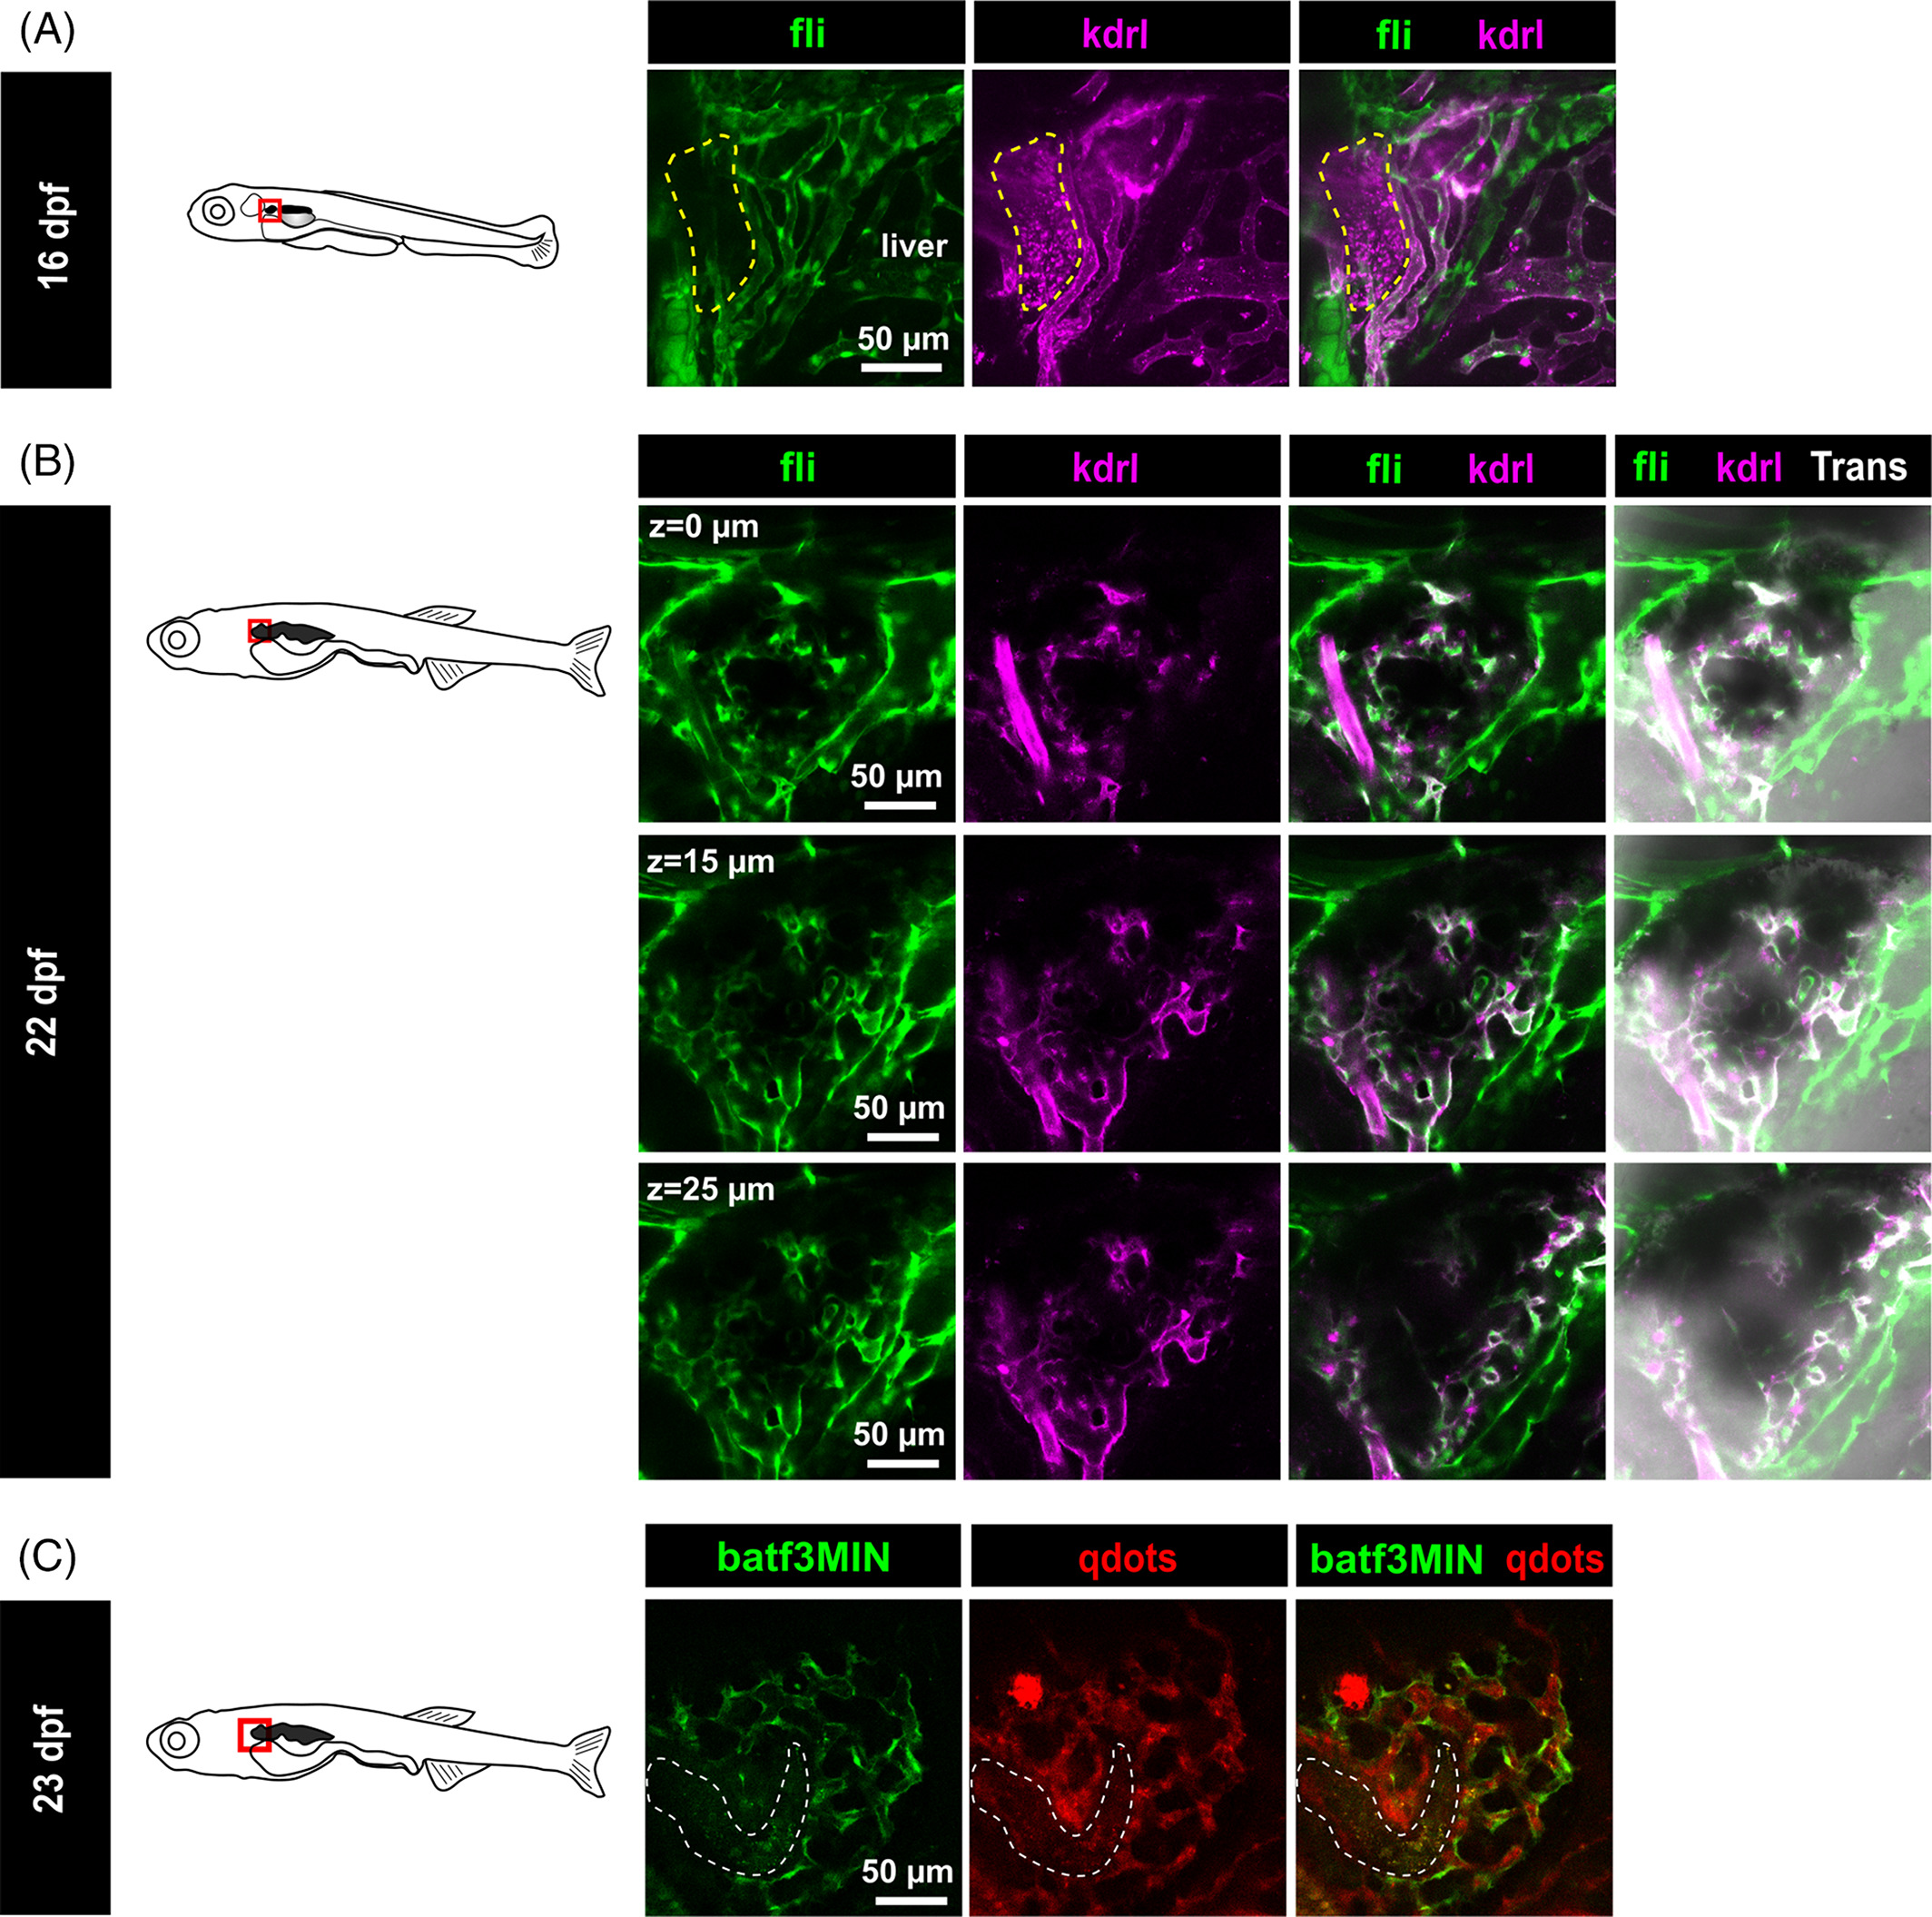
Fig. 6 Vascular and lymphatic networks in the head kidney from larvae to juvenile. A, Left panel. Diagram of a 16 dpf zebrafish larvae showing the acquired pronephros region. Right panels: Maximum projection of the head kidney from a double Tg(fli1:GFP) x Tg(kdrl:Hsa.HRAS-mCherry) transgenic fish at 16dpf. Dash lines indicate the kidney tubules. B, Left panel: Diagram of a 22 dpf zebrafish larvae showing the acquired pronephros region. Right panels: Optical sections of two-photon acquisitions of the head kidney from a double Tg(fli1:GFP) x Tg(kdrl:Hsa.HRAS-mCherry) transgenic fish at 22 dpf. C, Left panel: Diagram of a 23 dpf zebrafish larvae showing the acquired pronephros region. Right panel: Angiogram of a 23 dpf Tg(batf3MIN:eGFP) transgenic fish injected with qdots