IMAGE

Figure 2

ID
ZDB-IMAGE-210531-2
Source
Figures for Mathieu et al., 2021
Image
Figure Caption

Figure 2

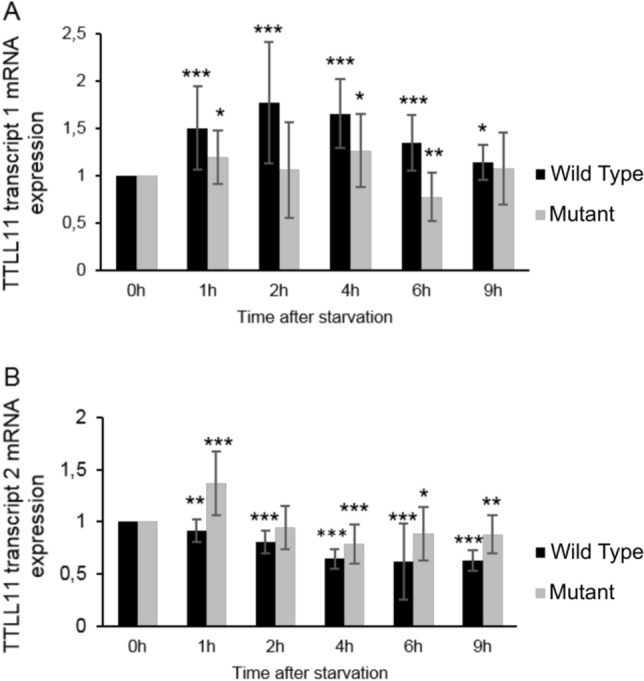
WT and mutant TTLL11 mRNA expression after starvation. WT (DE0194) and mutant (DE0193) fibroblasts were treated with medium without FBS for different times. Cells were then processed for mRNA isolation and the relative mRNA expression of both transcript 1 (A) and 2 (B) of TTLL11 at different time point after serum starvation were determined by qPCR. The levels of mRNAs were plotted relative to cells harvested at 0 h (n = 3). Error bars represent SD. The difference between one independent group and the control group 0 h was examined by unpaired, two-tailed Student’s t-test, *P ≤ 0.05, **P ≤ 0.01, ***P ≤ 0.001.

Acknowledgments
This image is the copyrighted work of the attributed author or publisher, and ZFIN has permission only to display this image to its users. Additional permissions should be obtained from the applicable author or publisher of the image. Full text @ Sci. Rep.