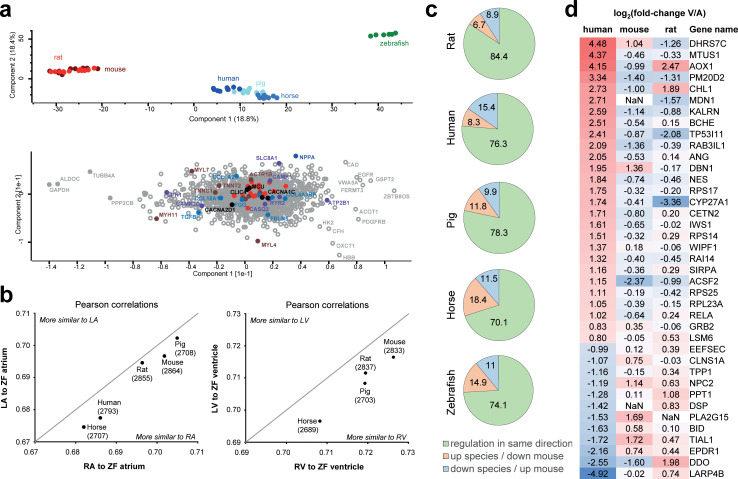
Fig 4 (a) PCA (top) shows that the main sources of variation in the dataset are contributed by (i) the zebrafish samples (green) being different from all mammalian samples; and (ii) small mammals (red) being different from large mammals (blue). Analysis of which proteins explain most of the sample variance between samples (bottom) highlights, e.g., MYL4 and MYL7 showing high variance between zebrafish and large mammals along component 2, as well as NPPA, MYH11, and SLC8A1 highlighted as major contributors to the intermammalian differences. Reference sets of mitochondrial proteins are highlighted in orange, which show comparably lower loadings. This analysis is based on data presented in S8 Table. (b) Analysis of zebrafish protein abundance profile in atria and ventricle compared to corresponding mammalian protein abundance profiles in left and RV and atria. Pearson correlation analysis across all proteins consistently shows higher similarity to right side of the mammalian hearts, for ventricle as well as atria. This analysis is based on data presented in S8 Table. (c) Comparison of protein abundance differences between atria and ventricles across species. Protein abundances in ventricle compared to atria were calculated for mouse heart, and ratios were compared to all other species. Pie charts illustrate the percentage of proteins showing same direction of regulation (green), higher abundance in atria in other species in contrast to mouse (orange), and higher abundance in ventricle in other species contrary to finding in mouse (blue). (d) Proteins significantly differentially expressed between human ventricle and atria, which show opposite abundance profile in mouse and/or rat compared to human. log2 fold change of atria versus ventricle are shown, i.e., proteins higher expressed in ventricle are denoted positive (red), and those higher expressed in atria are denoted negative (blue). LA, left atrium; PCA, principal component analysis; RA, right atrium; RV, right ventricle.
Image
Figure Caption
Acknowledgments
This image is the copyrighted work of the attributed author or publisher, and
ZFIN has permission only to display this image to its users.
Additional permissions should be obtained from the applicable author or publisher of the image.
Full text @ PLoS Biol.

