IMAGE

Fig. 6

ID
ZDB-IMAGE-210508-22
Source
Figures for Laquatra et al., 2021
Image
Figure Caption

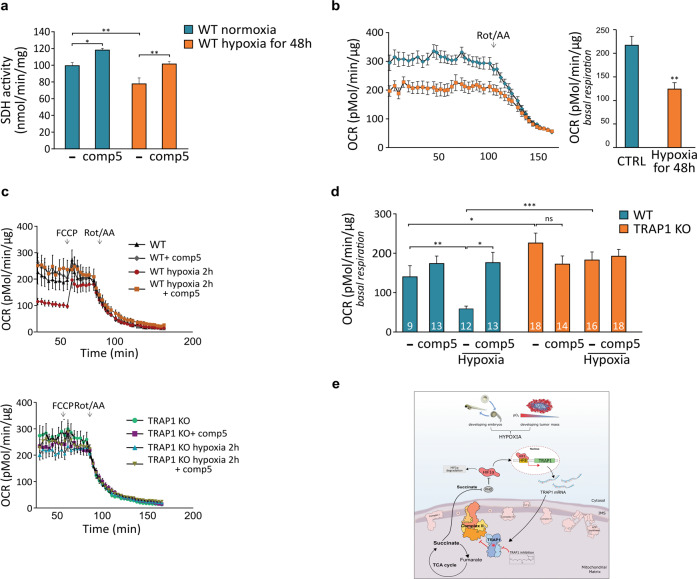
Fig. 6 TRAP1 inhibits respiration under hypoxia.

a Spectrophotometric measurements of SDH activity on wild-type Zebrafish embryos kept in normoxia or hypoxia (5% O2) for 48 h. Where indicated, embryos were treated with the specific TRAP1 inhibitor compound 5 (100 μM, 2 h). b Assessment of oxygen consumption rate (OCR) in wild-type embryos at 96 hpf, either untreated (blue line and bar) or exposed to hypoxia for 48 h (orange line and bar). Respiratory complex I and III inhibitors (2 μM rotenone and 5 μM antimycin A, respectively) were added where indicated. c, d OCR measurements in TRAP1 wild-type and knock-out living Zebrafish embryos, either kept in normoxic condition or after 2 h of exposure to hypoxia (5% O2). Subsequent additions of the proton uncoupler carbonyl cyanide-4-(trifluoromethoxy)phenylhydrazone (FCCP, 0.5 μM) and of the respiratory complex I and III inhibitors (2 μM rotenone and 5 μM antimycin A, respectively) were carried out as indicated. The specific TRAP1 inhibitor compound 5 (100 μM) was added in fish water 4 h prior to OCR analysis. In fish exposed to hypoxia, the drug was added 2 h before hypoxic treatment and maintained throughout hypoxia exposure. The number of animals used for each condition is reported inside column bars. e Schematic representation of the feed-forward crosstalk between HIF1α and TRAP1. In (a–d), data are reported as average ±SEM with one-way ANOVA and Bonferroni’s correction of four independent experiments (a, c, d), or at least 20 animals per condition (b) with an unpaired two-tailed Student’s t test. Asterisks indicate significant differences (*p < 0.05, ∗∗p < 0.01, ***p < 0.001).

Figure Data
Acknowledgments
This image is the copyrighted work of the attributed author or publisher, and ZFIN has permission only to display this image to its users. Additional permissions should be obtained from the applicable author or publisher of the image. Full text @ Cell Death Dis.