
|
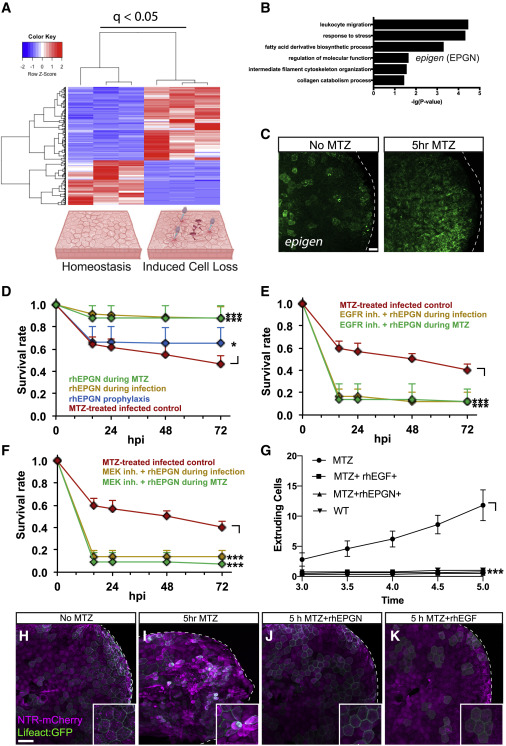
Fig. 4 Treatment with rhEPGN suppresses epithelial cell extrusion and attenuates invasive fungal infection (A) Heatmap of differentially expressed genes between homeostatic conditions (no MTZ) and induced epithelial cell loss by extrusion (MTZ-treated). q < 0.05, adjusted p value, Deseq2 and Benjamini-Hochberg method for FDR correction, three independent biological replicates, 15–30 larvae per replicate. (B) Gene Ontology (GO) analysis of gene categories enriched after epithelial cell loss. (C) Maximum intensity projections of fluorescent in situ hybridization for epigen in larvae with induced cell loss compared with homeostasis. Scale bar, 20 μm. (D–F) Larval survival after treatment with rhEPGN (D), rhEPGN and the EGFR inhibitor AG1478 (E), or rhEPGN and the MEK inhibitor U0126 (F) at different times during induction of damage and infection. Aggregated survival rates based on five (D, n = 72–74 per condition) or three independent experiments (E and F, n = 42–43 per condition), respectively, are plotted. Error bars represent SD; Mantel-Cox log rank test. (G) Quantification of the number of extruding cells with and without rhEPGN or rhEGF treatment during induced damage. Data are from three independent experiments, and error bars represent SD; ∗∗∗p < 0.001; ordinary one-way analysis of variance (ANOVA) with Dunnett’s multiple comparisons test. (H–K) Maximum intensity projections of confocal still images of a time-lapse sequence after induction of epithelial cell loss (H and I) and during treatment with rhEPGN (J) or rhEGF (K). Scale bar, 50 μm.