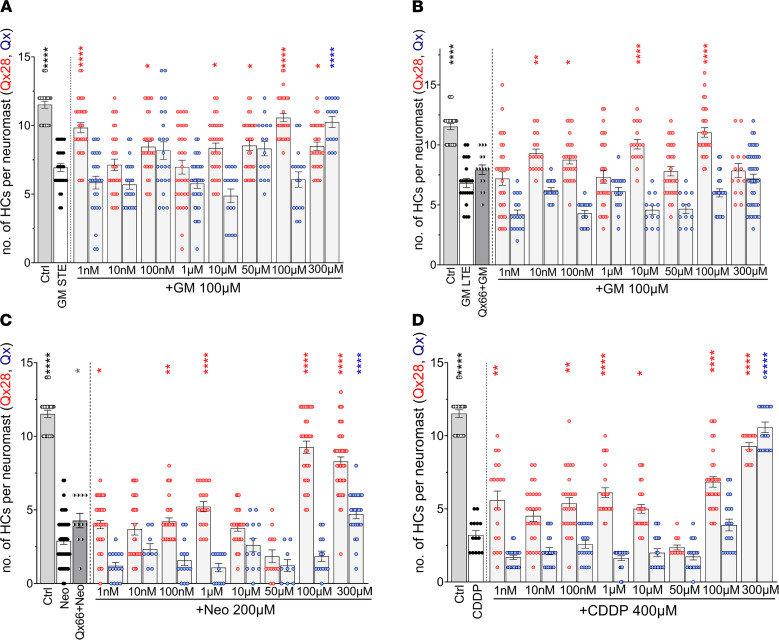
Figure 3 Qx28 protects from aminoglycoside- and CDDP-induced hair cell death. Quantification of the number of hair cells per neuromasts after the different ototoxin treatments in the presence or absence of quinoxaline (Qx, blue dots) or Qx28 (red dots). (A) Short-term gentamicin exposure (100 μM). (B) Long-term gentamicin exposure (100 μM). (C) Neomycin exposure (200 μM). (D) CDDP exposure (400 μM). Qx66 50 μM was included to show that although it has a similar structure as Qx28, it does not protect. Results are expressed as mean ± SEM. Statistical analysis: 1-way ANOVA with correction for Dunnett’s multiple comparisons test. *P < 0.05, **P < 0.01, ****P < 0.0001 versus ototoxin alone (blue asterisks, quinoxaline treatment; red asterisks, Qx28 treatment). Neuromasts inspected: vehicle = 20; GM-STE: GM alone = 29; GM+Qx28 = 29 (1 nM, 300 μM), 31 (10 nM–100 μM); GM+Qx = 25 (1 nM–100 nM), 30 (1 μM), 16 (10 μM–300 μM). GM-LTE: GM alone = 22; GM + Qx66 = 15; GM+Qx28 = 30 (1 nM, 1 μM, 50 μM, 100 μM), 17 (10 nM, 10 μM), 25 (100 nM), 14 (300 μM); GM+Qx = 17 (1 nM–1 μM, 100 μM), 12 (10 μM, 50 μM), 42 (300 μM). Neo: Neo alone = 44; Neo+Qx66 = 11; Neo+Qx28 = 28 (1 nM, 100 μM), 22 (10 nM, 100 nM, 10 μM), 18 (1 μM), 13 (50 μM), 34 (300 μM); Neo+Qx = 4 (1 nM, 100 nM, 10 μM, 100 μM), 9 (10 nM, 50 μM), 12 (1 μM), 24 (300 μM). CDDP: CDDP alone = 14; CDDP + Q28 = 19 (1 nM, 1 μM), 27 (10 nM, 100 nM), 23 (10 μM), 10 (50 μM), 32 (100 μM), 14 (300 μM); CDDP+Qx = 19 (1 nM–100 nM, 50 μM–300 μM), 13 (1 μM), 15 (10 μM).
Image
Figure Caption
Figure Data
Acknowledgments
This image is the copyrighted work of the attributed author or publisher, and
ZFIN has permission only to display this image to its users.
Additional permissions should be obtained from the applicable author or publisher of the image.
Full text @ JCI Insight

