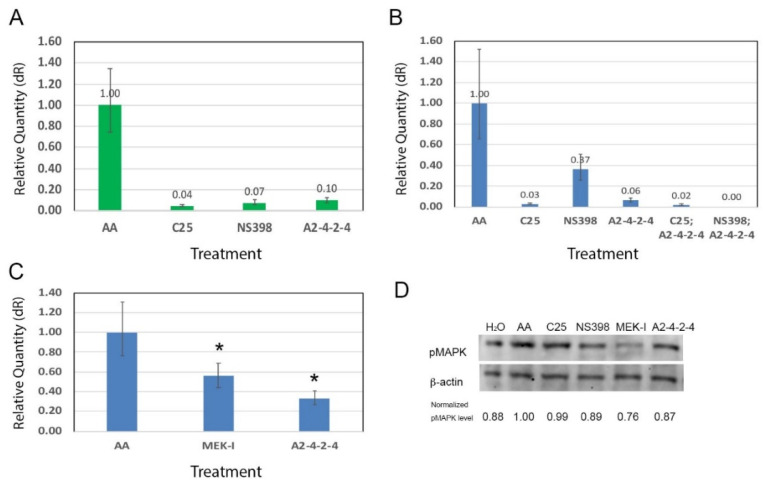
Figure 5 Possible molecular mechanisms of A2-4-2-4. (A) The COX-2 gene expression, measured by qRT-PCR, was high in embryos treated with AA alone but significantly lower in those treated with AA plus C25, NS398, or A2-4-2-4. (B) A2-4-2-4 showed a synergistic effect with NS398 in suppressing inflammation. While the COX-2 expression level in embryos treated with AA and a sub-dosage of NS398 was 0.37 folds of that in embryos treated with AA alone, the COX-2 level was near zero in the embryos treated with NS398; A2-4-2-4. (C) The tnnt-2 expression, an indicator of cardiac hypertrophy, was high in embryos treated with AA alone but significantly lower in embryos treated with AA plus MEK-I or AA plus A2-4-2-4. (* indicates statistical significance between the compound and AA control, t-test, p < 0.05.) (D) Western blotting with anti-phosphorylated MAPK (pMAPK) showed that A2-4-2-4 moderately suppressed the MAPK signaling pathway. The normalized pMAPK level was done by dividing the band intensity in pixels using photoshop of pMAPK by that of β-actin for each sample.
Image
Figure Caption
Figure Data
Acknowledgments
This image is the copyrighted work of the attributed author or publisher, and
ZFIN has permission only to display this image to its users.
Additional permissions should be obtained from the applicable author or publisher of the image.
Full text @ Pharmaceuticals (Basel)

