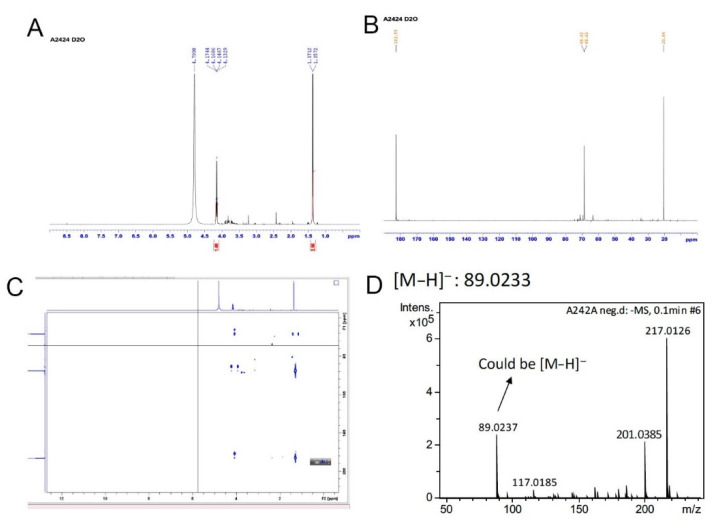
Figure 3 Chemical analyses for A2-4-2-4. A2-4-2-4 was analyzed using NMR and ESIMS. (A) The 1H-NMR graph indicates a methyl group (δH 1.3, d, J = 7.0 Hz) and a methane group (δH 4.16, q, J = 7.0 Hz) in A2-4-2-4. (B) The 13C-NMR indicates a carboxyl group (δC 182.5), a hydroxyl group (δH 68.6), and a methyl group (δH 20.4) in the major compound in A2-4-2-4. (C) The 2-dimensional NMR, using heteronuclear multiple bond correlation, further confirmed that the major compound in A2-4-2-4 is lactate. (D) ESIMS analysis revealed that the molecular weight of the major compound in A2-4-2-4 is 89.0233 (C3H6O3).
Image
Figure Caption
Acknowledgments
This image is the copyrighted work of the attributed author or publisher, and
ZFIN has permission only to display this image to its users.
Additional permissions should be obtained from the applicable author or publisher of the image.
Full text @ Pharmaceuticals (Basel)

