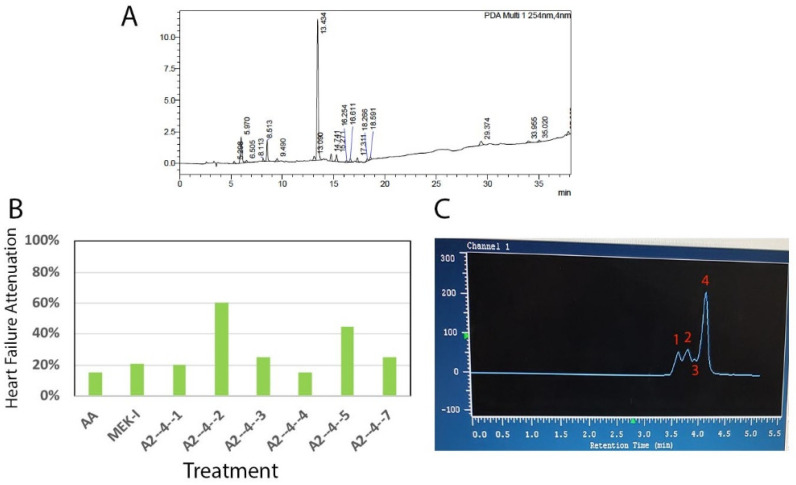
Figure 2 A2-4-2-4 purification. (A) HPLC analysis showed many compounds in the A2 fraction. (B) The A2-4 fraction was further separated into seven fractions, A2-4-1 to A2-4-7. Among them, A2-4-2 showed the highest AHF attenuation activity. (C) A representative UV absorbance graph during the preparative HPLC for A2-4-2 revealed that the A2-4-2 fraction contains four UV absorbance peaks which are significantly overlapped. Although extreme care was taken to separate the compounds into the final four fractions, named A2-4-2-1 to A2-4-2-4, the NMR analysis eventually showed impurities in A2-4-2-4 (see Figure 3).
Image
Figure Caption
Acknowledgments
This image is the copyrighted work of the attributed author or publisher, and
ZFIN has permission only to display this image to its users.
Additional permissions should be obtained from the applicable author or publisher of the image.
Full text @ Pharmaceuticals (Basel)

