|
FIGURE 4
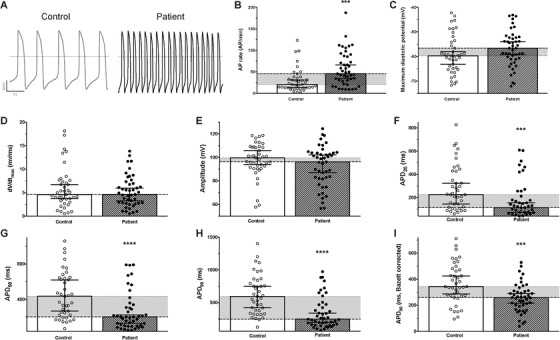
Spontaneous electrical activity of control and patient‐specific hiPSC‐CM. (A) Raw traces illustrating the recording of spontaneous electrical activity (action potentials, AP) of control (left) and patient‐specific (right) hiPSC‐CM. (B

|
|
FIGURE 4
Spontaneous electrical activity of control and patient‐specific hiPSC‐CM. (A) Raw traces illustrating the recording of spontaneous electrical activity (action potentials, AP) of control (left) and patient‐specific (right) hiPSC‐CM. (B