
|
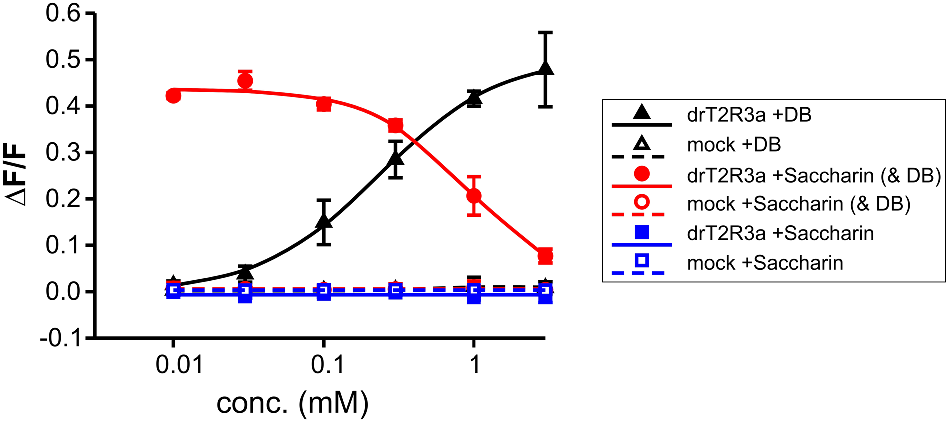
Fig. 4 Inhibition of denatonium responses of drT2R3a by saccharin. The cDNA of the bitter taste receptor drT2R3a was transiently transfected into HEK 293T-Gα16gust44 cells and subsequently subjected to calcium mobilization assays using an automated fluorometric imaging plate reader (FLIPRtetra). Cells transfected with an empty expression vector served as negative controls (mock). The responses of drT2R3a to denatonium benzoate (DB, black curves), saccharin (blue curves), and 1 mM denatonium benzoate and increasing saccharin concentrations (red curves) are shown. The relative changes in fluorescence (ΔF/F) are plotted on the y axis (means ± SD, n = 4), the applied compound concentrations on the logarithmically scaled x axis.