
|
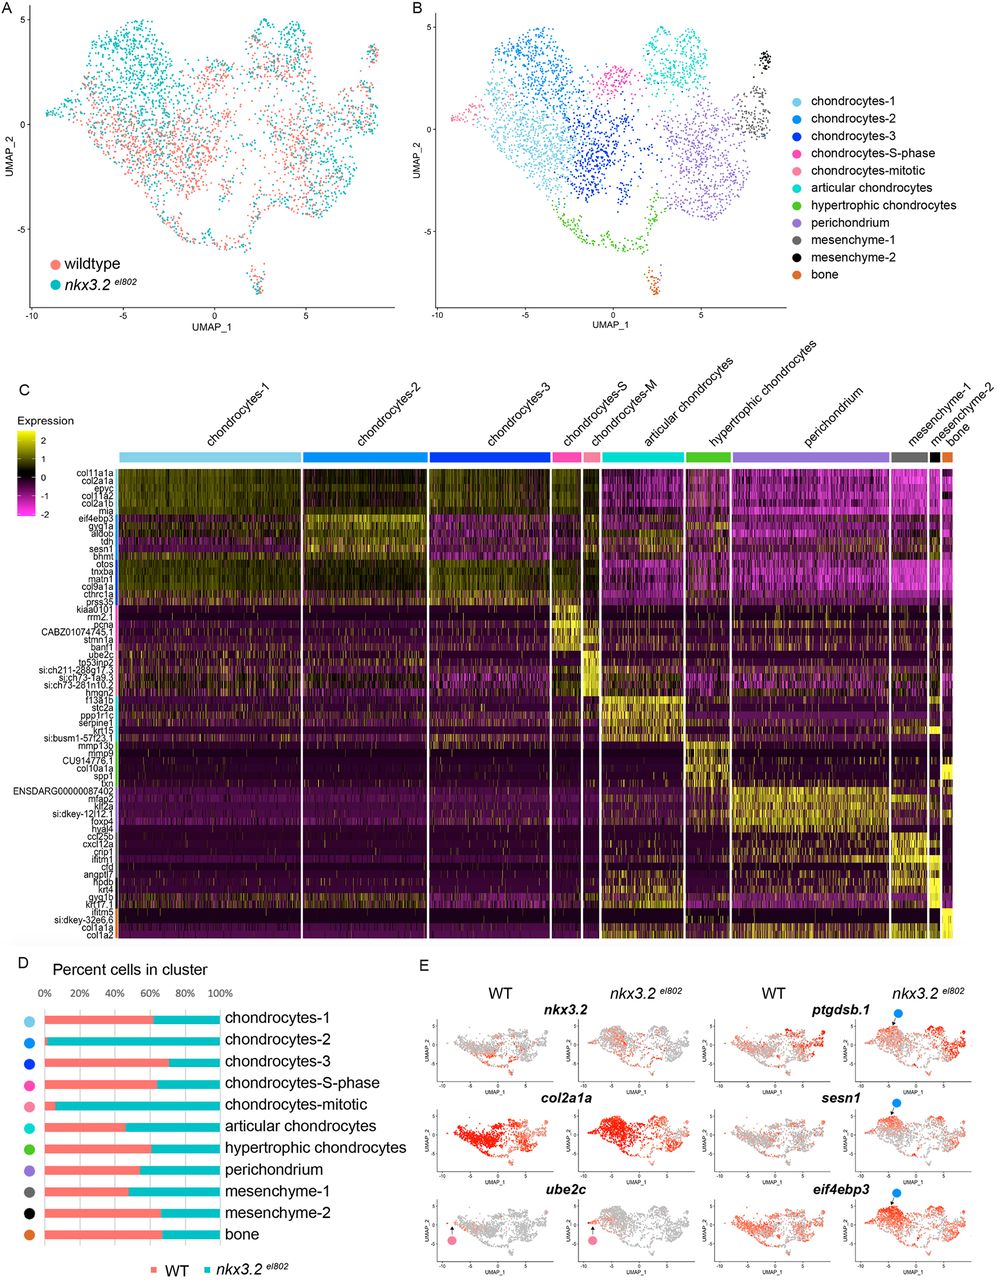
Fig. 5 Single-cell analysis reveals altered facial chondrocyte subtypes in nkx3.2 mutants. (A,B) UMAP projections of the aggregate datasets colored according to dataset (A) or cluster identity (B). (C) Heatmap of the top 4-6 enriched genes per cluster. Yellow indicates high expression and magenta minimal. (D) Percent contribution within each cluster by control (WT) and mutant cells. (E) UMAP projections of gene expression split by genotype. Red indicates high expression and grey minimal. Pink circles indicate position of the mitotic chondrocytes cluster and blue circles indicate the chondrocytes-2 cluster.