IMAGE

Fig. 7

ID
ZDB-IMAGE-210311-15
Genes
Source
Figures for Castellanos et al., 2021
Image
Figure Caption

Fig. 7

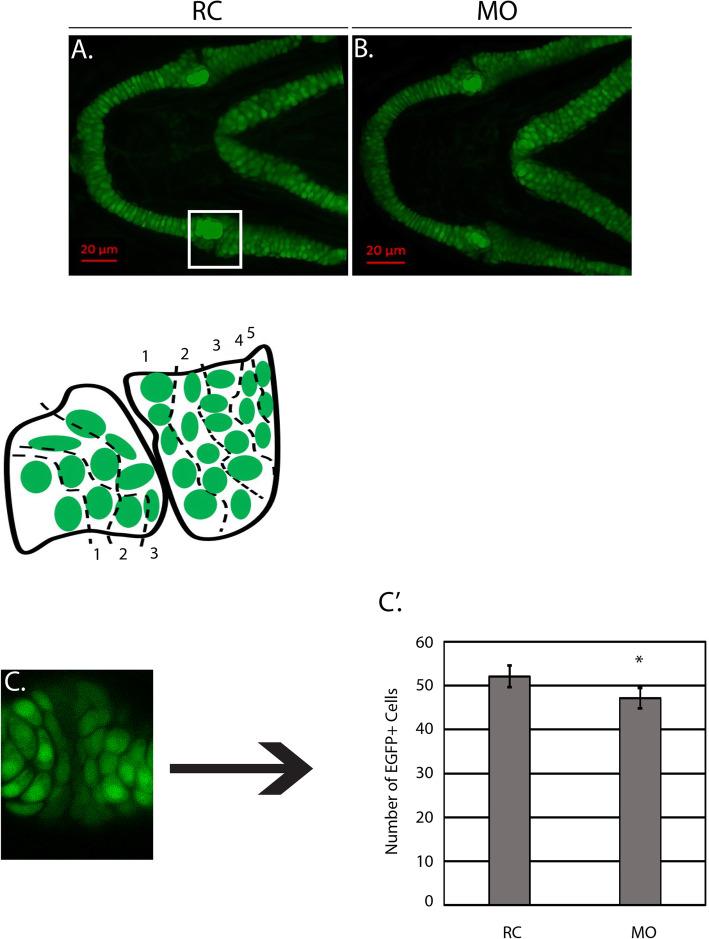
The number of Col2a1a+ cells is decreased at 4 DPF. a-bTg(col2a2a:EGFP) random control (RC) and morphant (MO) larvae (N = 10 per group) were mounted in agarose and confocal images were taken at 4 days post fertilization (DPF). c shows the representative region where cells were quantified with a corresponding schematic showing the parameters (3 rows left, 5 rows right). c′ Average number of Col2a1a+ cells counted across both groups (N = 10 per groups) at 4 DPF. P-value pertains to the statistically significant difference between the RC group and the MOs (***p = 1.44x− 05)

Figure Data
Acknowledgments
This image is the copyrighted work of the attributed author or publisher, and ZFIN has permission only to display this image to its users. Additional permissions should be obtained from the applicable author or publisher of the image. Full text @ BMC Dev. Biol.