Image
Figure Caption
Figure 6
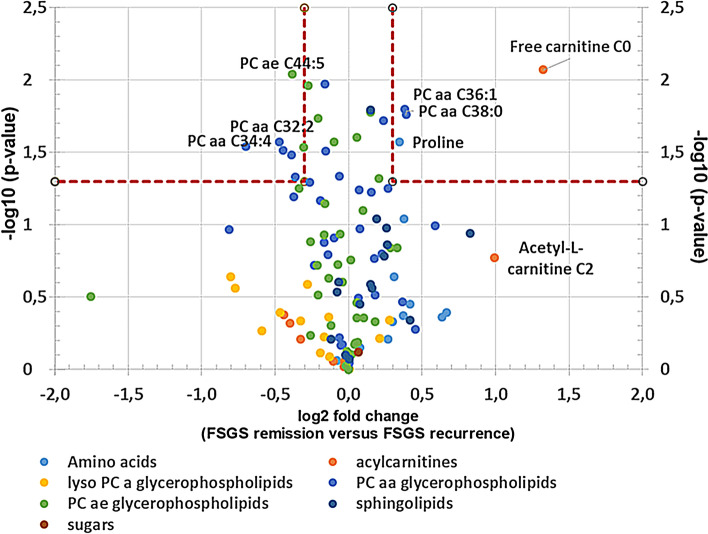
Serum metabolome analysis of recurrent FSGS reveals changes in carnitine and phosphatidylcholine-levels. Volcano-Plot of the serum metabolome analysis of the patient with FSGS. Log2 fold change of metabolites at FSGS remission versus FSGS recurrence as well as –log10 (p-values) are given. PCaaC34:4 and
Acknowledgments
This image is the copyrighted work of the attributed author or publisher, and
ZFIN has permission only to display this image to its users.
Additional permissions should be obtained from the applicable author or publisher of the image.
Full text @ Sci. Rep.

