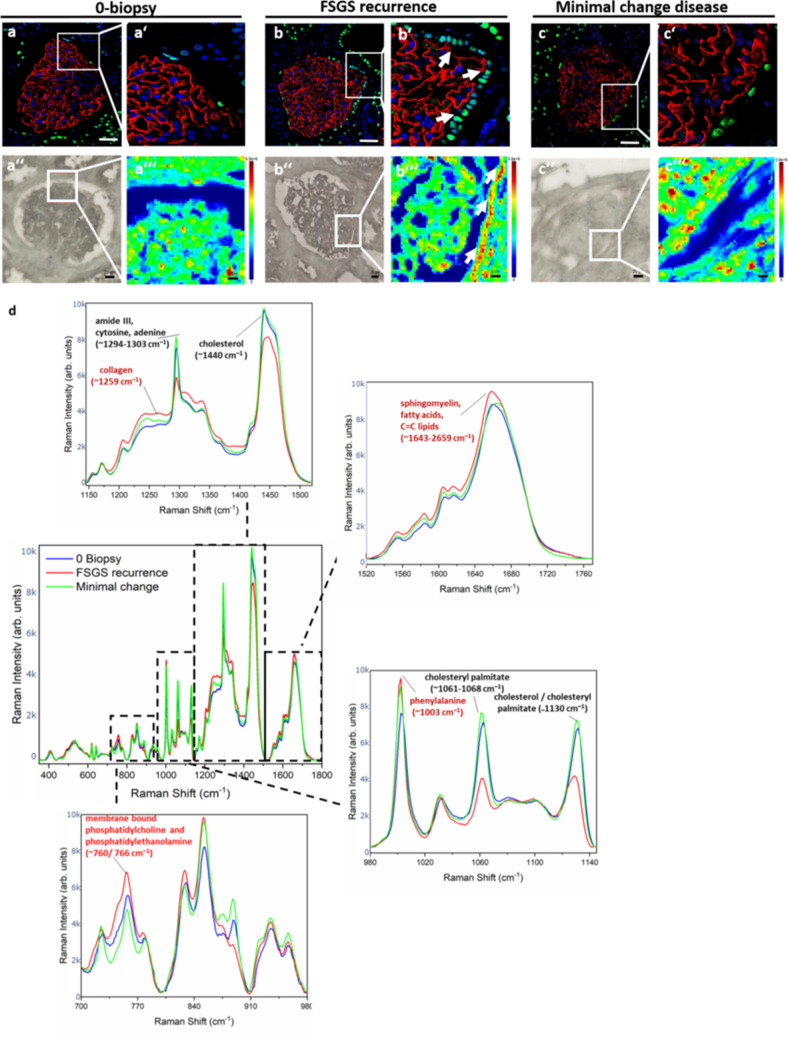
Raman spectroscopy gives a molecular fingerprint of recurrent FSGS on tissue level. (a,b) PAX8 staining (green) and synaptopodin staining (red) of a glomerulus from the kidney biopsy at transplantation (0-biopsy) (a,a′) and at the time of FSGS recurrence (FSGS recurrence) (b,b′) and from a patient with minimal change disease (c,c′) showing increased PAX8 staining in the Bowman’s capsule (arrow head in b′), scale bar = 100 µm. Representative bright field illumination (a″,b″,c″) and heat map of Raman signal intensity (a‴,b‴,c‴) of a glomerulus from the kidney biopsy at transplantation (0-biopsy) (a″,a‴), at the time of FSGS recurrence (FSGS recurrence) (b″,b‴) and of a biopsy with minimal change disease (c″,c‴) showing increased Raman signal at the region of parietal epithelial cell in the Bowman’s capsule (arrow head in b‴). Scale bar = 50 µm. (d) Mean Raman spectra of three glomeruli from the kidney biopsy at transplantation (blue line) and three glomeruli at the time of FSGS recurrence (red line). Assignments of the Raman peaks according to the literature are given.
Acknowledgments
This image is the copyrighted work of the attributed author or publisher, and
ZFIN has permission only to display this image to its users.
Additional permissions should be obtained from the applicable author or publisher of the image.
Full text @ Sci. Rep.
Your Input Welcome
Thank you for submitting comments. Your input has been emailed to ZFIN curators who may contact you if
additional information is required.
Oops. Something went wrong. Please try again later.