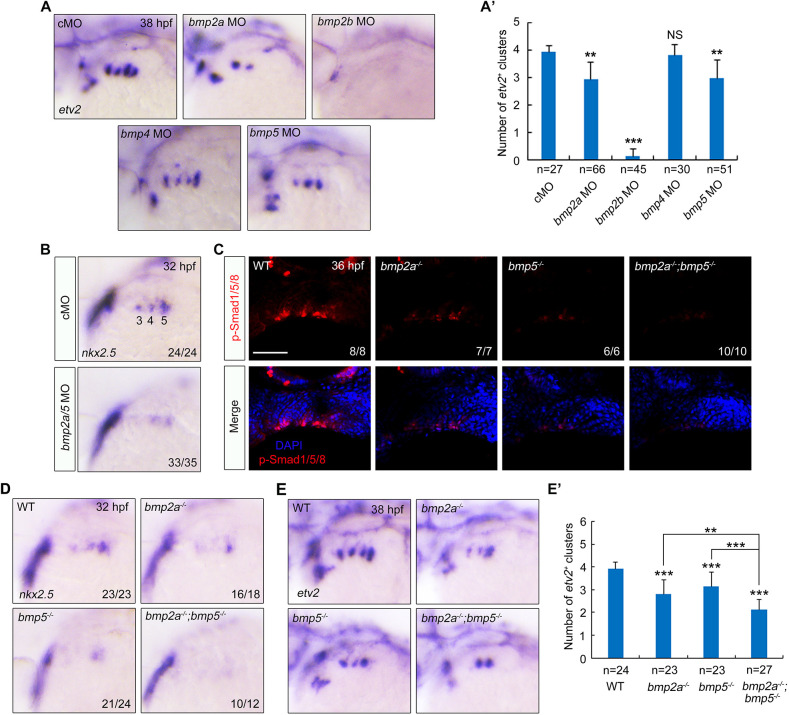
Fig. 6. BMP2a together with BMP5 functions in PAA progenitor specification. (A,A′) The expression of etv2 in embryos injected with indicated MO was analyzed by in situ hybridization (A). Injection doses: bmp2a MO, 2 ng; bmp2b MO, 0.3 ng; bmp4 MO, 2 ng; bmp5 MO, 4 ng. The average numbers of etv2+ PAA angioblast clusters were quantified from three independent experiments, and the group values are expressed as mean±s.d. (A′). Student's t-test (**P<0.01, ***P<0.001; NS, no significant difference). (B) Knockdown of bmp2a and bmp5 disrupted the specification of PAA progenitors. Wild-type embryos were injected with bmp2a and bmp5 MOs at the one-cell stage. The resulting embryos were harvested for in situ hybridization. (C) Wild-type and indicated mutant embryos were harvested at 36 hpf for immunofluorescence assay with anti-p-Smas1/5/8 antibody. Nuclei were counterstained with DAPI. There is a distinct decrease of p-Smad1/5/8 in the bmp2a−/−;bmp5−/− double mutants. Scale bar: 50 μm. (D-E′) Expression analysis of nkx2.5 (D) and etv2 (E) in bmp2a−/− or bmp5−/− embryos and bmp2a−/−;bmp5−/− double mutants by in situ hybridization. The average numbers of etv2+ angioblast clusters were quantified from three independent experiments and the group values were expressed as mean±s.d. (E′). Student's t-test was used to determine the significance of differences between wild-type animals and each mutant, and one-way ANOVA test was performed to analyze the statistical differences between bmp2a−/−;bmp5−/− double mutants and bmp2a−/− or bmp5−/− embryos. **P<0.01, ***P<0.001.
Image
Figure Caption
Acknowledgments
This image is the copyrighted work of the attributed author or publisher, and
ZFIN has permission only to display this image to its users.
Additional permissions should be obtained from the applicable author or publisher of the image.
Full text @ Development

