
Image
|
Figure Caption
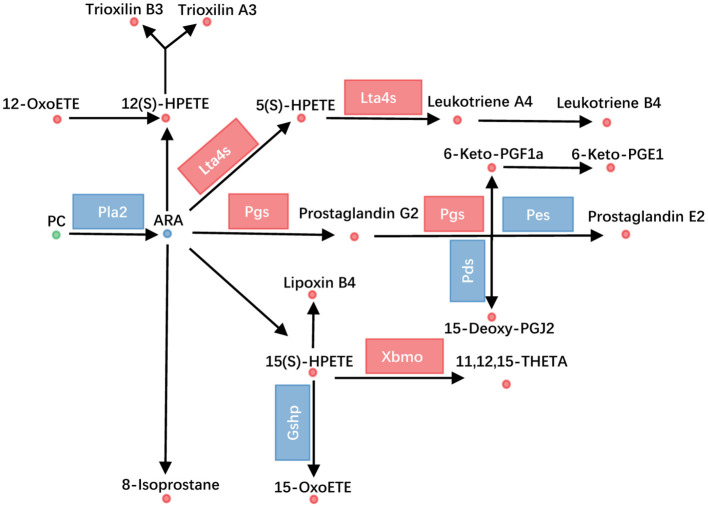
Figure 4
GCGR knockout influenced arachidonic acid metabolism. Disturbed arachidonic acid metabolism. Dots represent metabolites, and blocks represent transcripts-encode enzymes. Red: up-regulated, blue: down-regulated; or green: set substrates mixed with both up-regulated and down-regulated metabolites.
Acknowledgments
This image is the copyrighted work of the attributed author or publisher, and
ZFIN has permission only to display this image to its users.
Additional permissions should be obtained from the applicable author or publisher of the image.
Full text @ Front Cell Dev Biol