IMAGE

Figure 5

ID
ZDB-IMAGE-210130-38
Source
Figures for da Silva et al., 2020
Image
Figure Caption

Figure 5

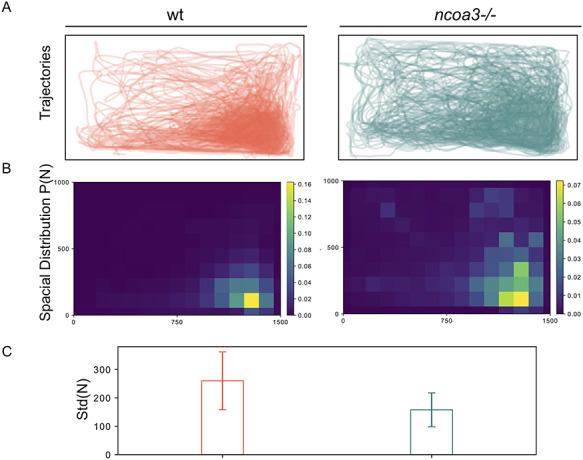
Altered swimming behaviour of adult ncoa3 −/− suggests hearing malfunction. A) Overlapped Trajectories of 1-year old wt (n = 7) and ncoa3−/− (n = 6). The bottom right corner is shaded, where the fish are more likely to stay. B) Average spatial distribution of wt and ncoa3−/−. A brighter colour indicates that the fish are more likely to stay in the respective region. For every trajectory acquired from different fish, the corresponding spatial distribution P(N) was calculated. From every P(N), the standard deviation of N in all the grids is calculated, noted as Std(N). C) Graph of Std(N) values for wt and ncoa3−/−. Error bars represent the standard deviation of Std(N). Non-parametric, two tailed, t-Test was used (p = 0.06).

Figure Data
Acknowledgments
This image is the copyrighted work of the attributed author or publisher, and ZFIN has permission only to display this image to its users. Additional permissions should be obtained from the applicable author or publisher of the image. Full text @ Hum. Mol. Genet.