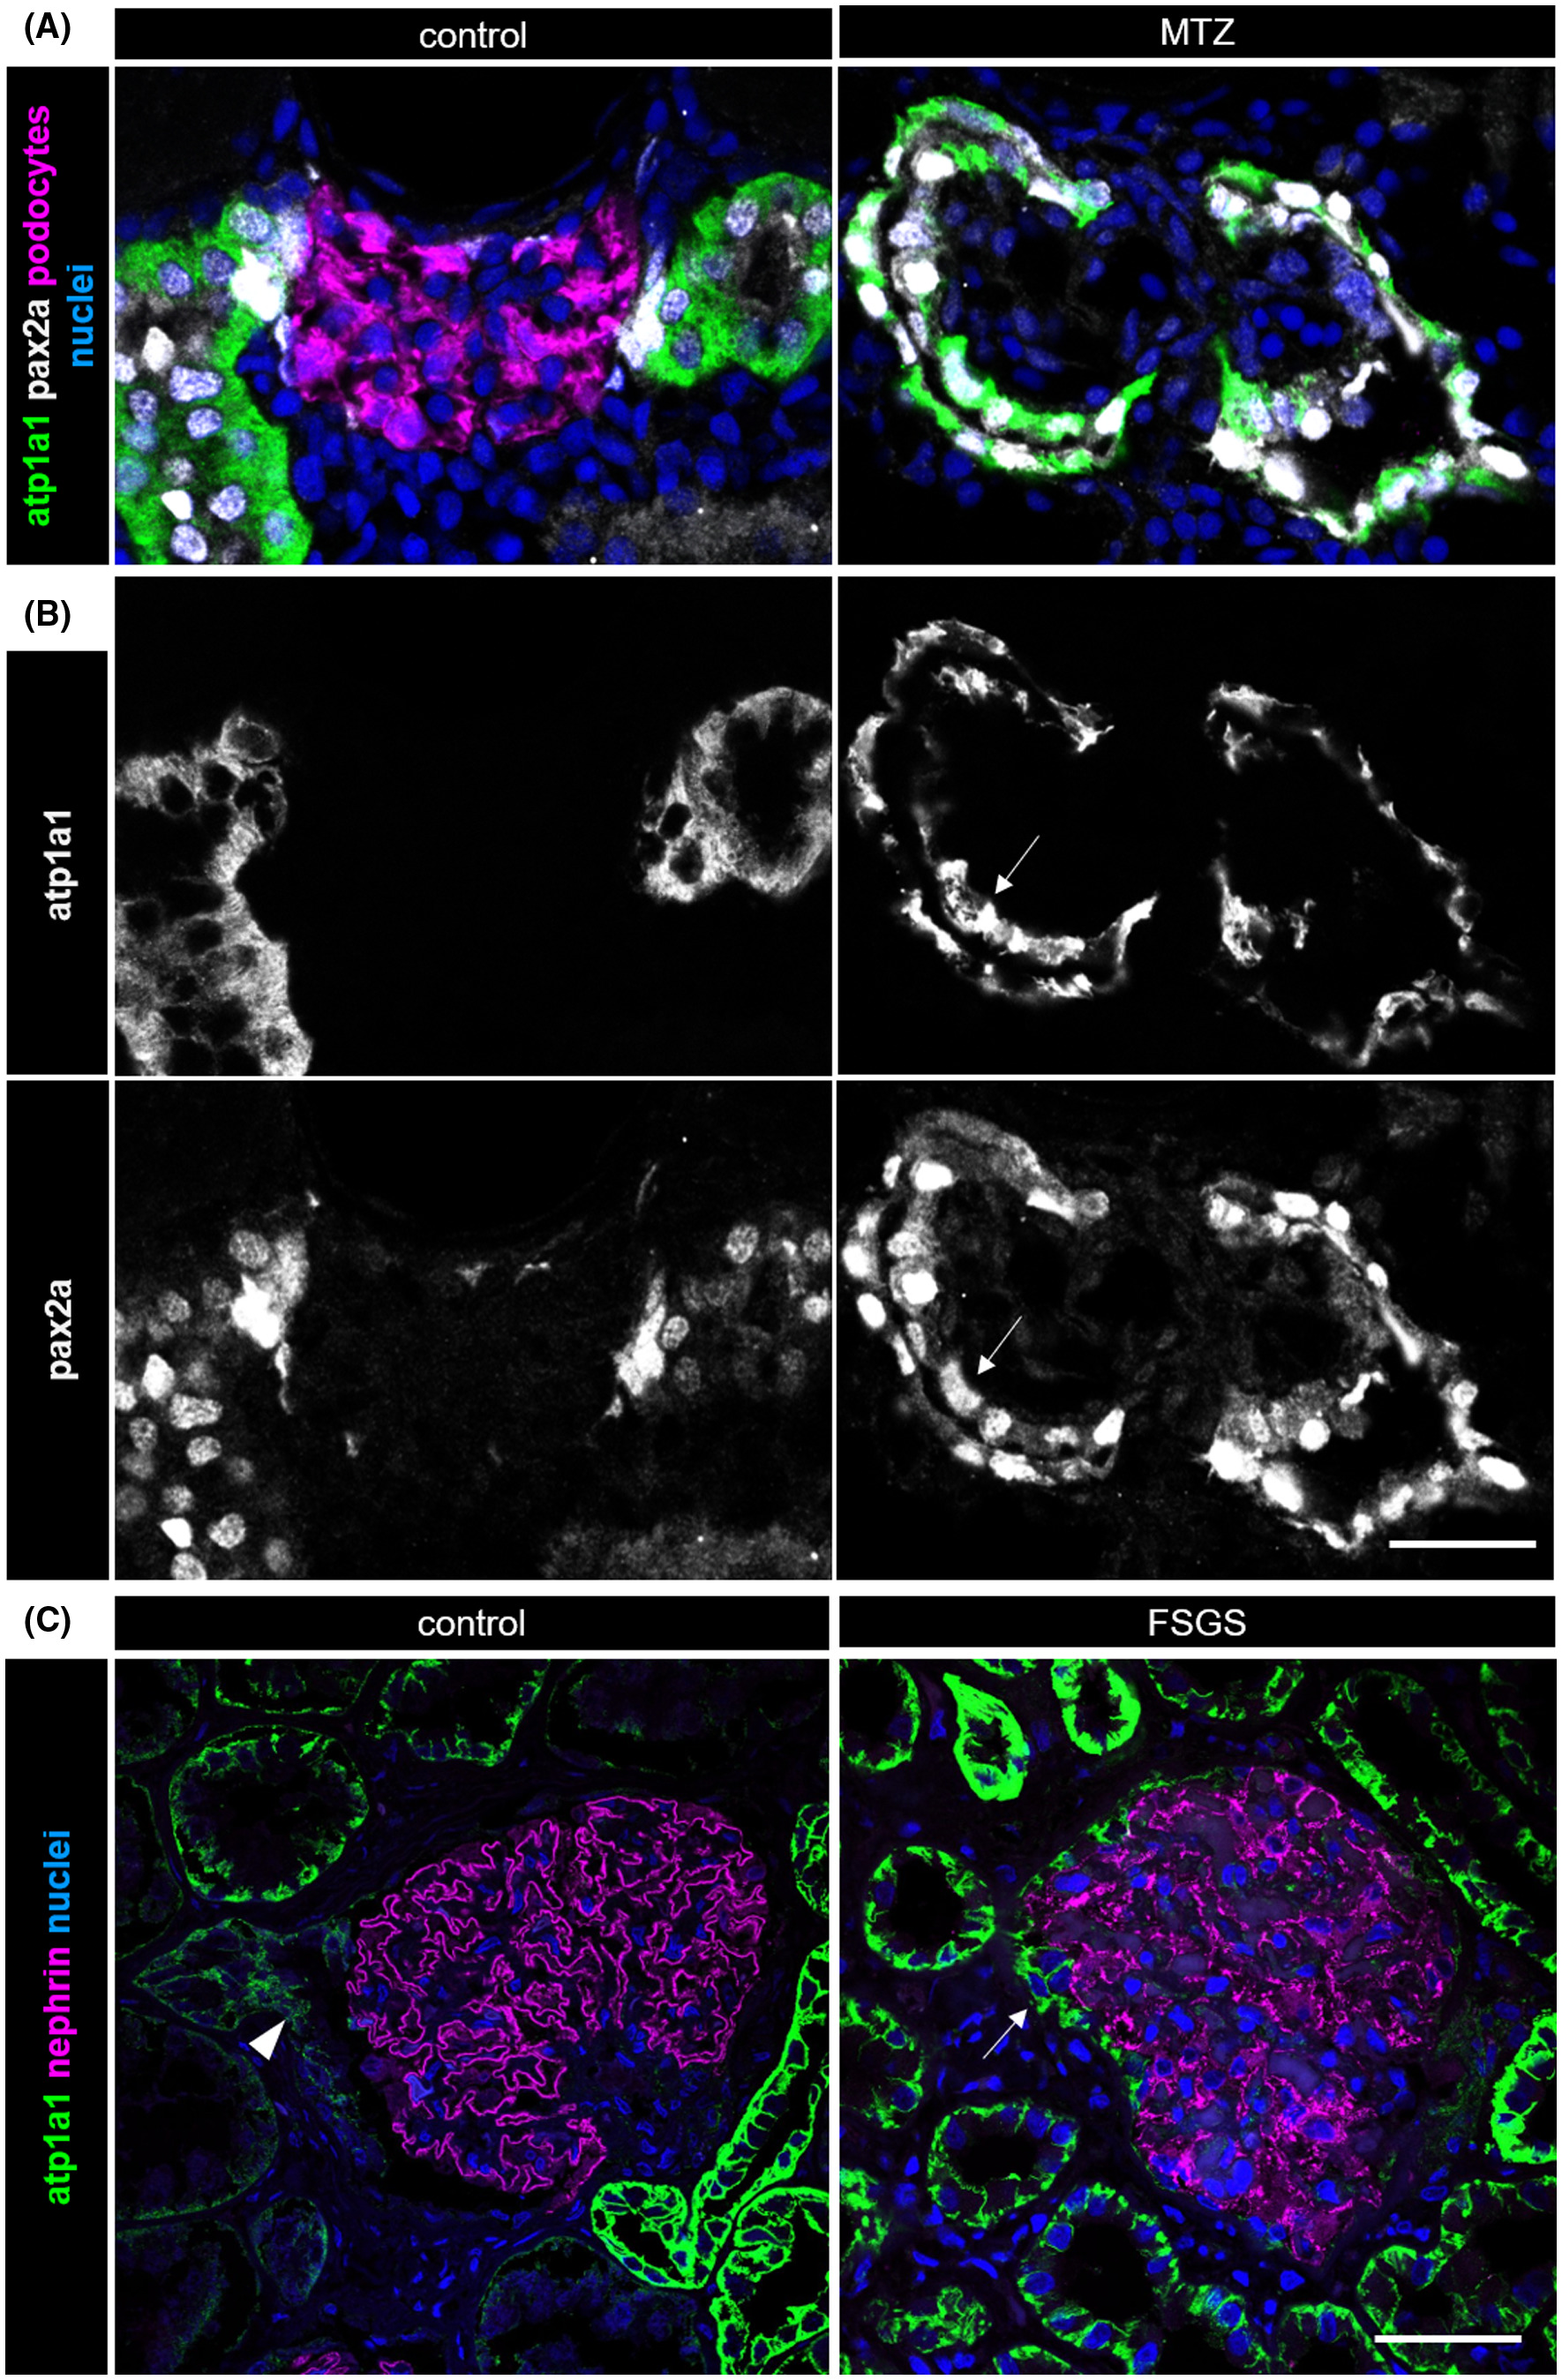
Fig. 5 Co‐expression of atp1a1 and pax2a in proximal tubule cells of 9 dpf zebrafish larvae is shown in A. Panel B shows atp1a1 expression and pax2a expression separately. It is limited to the proximal tubule in control larvae; whereas in podocyte‐depleted larvae, it is also found in activated parietal epithelial cells and on the glomerular tuft (white arrows). The scale bar represents 20 µm. The micrographs in C exemplary show atp1a1 expression in a human glomerulus under healthy conditions, where it is limited to the tubule (white arrowhead), and in a patient with FSGS. Notice atp1a1 positivity of cells on the glomerular capillaries in FSGS, highlighted by the white arrow. Nephrin expression marks podocytes. The scale bar represents 50 µm
Image
Figure Caption
Figure Data
Acknowledgments
This image is the copyrighted work of the attributed author or publisher, and
ZFIN has permission only to display this image to its users.
Additional permissions should be obtained from the applicable author or publisher of the image.
Full text @ FASEB J.

