
Image
|
Figure Caption
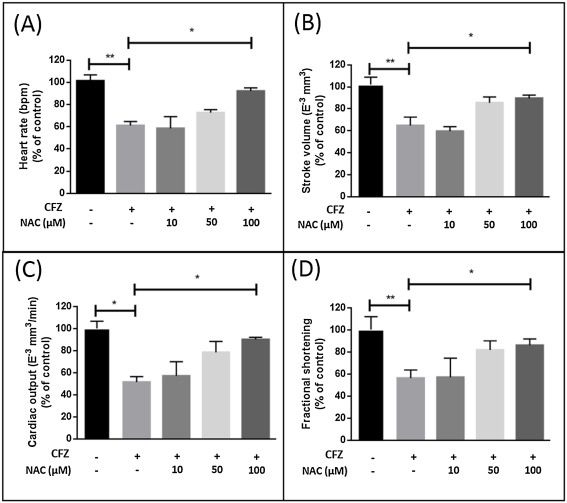
Fig. 3 Fig. 3. Cardiac functions of zebrafish (2 dpf) measured after 2 days of co-treatment with CFZ (4 mg/L) and various concentrations of NAC (10, 50, 100 μM) by (A) heart rate; (B) stroke volume; (C) cardiac output; and (D) percentage fractional shortening. Data are presented as mean ± S.D. *P < 0.05, **P < 0.01 significantly different compared with the control group.
Figure Data
Acknowledgments
This image is the copyrighted work of the attributed author or publisher, and
ZFIN has permission only to display this image to its users.
Additional permissions should be obtained from the applicable author or publisher of the image.
Full text @ Biomed. Pharmacother.