IMAGE

Figure 1

ID
ZDB-IMAGE-210123-12
Antibodies
Source
Figures for Helal et al., 2021
Image
Figure Caption

Figure 1

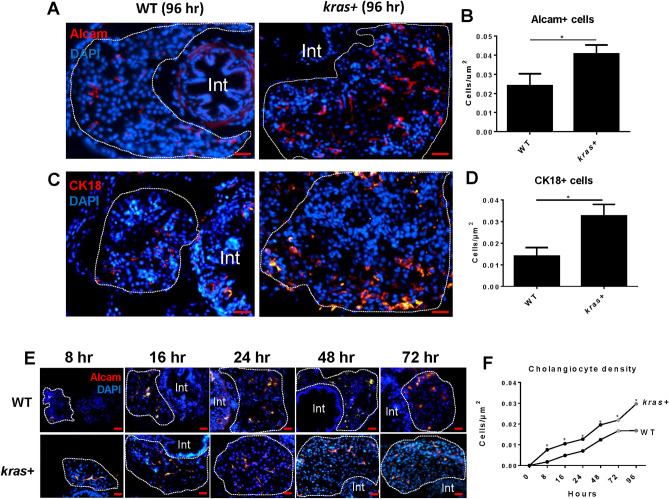
Increase of cholangiocytes upon induction of oncogenic krasV12 expression in hepatocytes of kras+ transgenic zebrafish larvae. Cholangiocytes were determined by using two different molecular markers: Alcam and Cytokeratin 18 (CK18). 3-dpf kras+ and WT zebrafish larvae were treated with 20 µg/ml Dox till 7 dpf. Samples were collected at different time points after Dox induction for immunohistochemistry. All liver sections were counter stained with DAPI. (AD) Representative images of Alcam antibody (A) and Cytokeratin 18 (Ck18) (C) and quantification of cholangiocyte density (B,D) in kras + and WT larvae at 96 h following Dox induction. (E,F) Time course of increase of cholangiocytes from 8 to 96 h following Dox induction. Representative images of Alcam staining of kras+ and WT larvae from 8 to 72 h are shown in (E) and 96 h in (A). Quantification of cholangiocyte density in kras+ and WT larvae is shown in (F). N = 10 at each time point. Scale bar: 20 μm. Statistical significance: *P˂0.05.

Figure Data
Acknowledgments
This image is the copyrighted work of the attributed author or publisher, and ZFIN has permission only to display this image to its users. Additional permissions should be obtained from the applicable author or publisher of the image. Full text @ Sci. Rep.