IMAGE

Figure 11

ID
ZDB-IMAGE-201130-45
Source
Figures for Lai et al., 2020
Image
Figure Caption

Figure 11

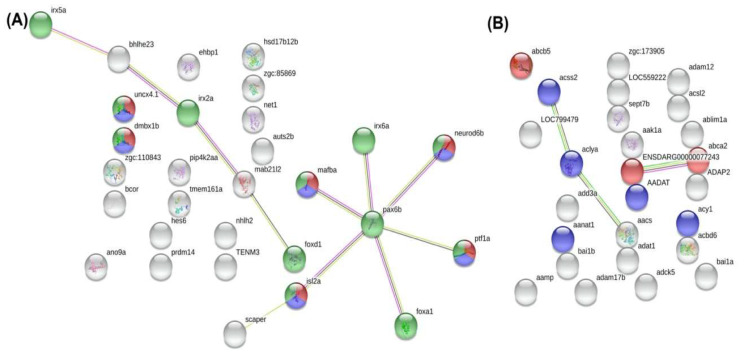
STRING protein interaction networking analysis between the (A) WT and dnmt3aa, and (B) WT and dnmt3ab KO zebrafish gene sets. (A) Red node represented protein involving in neuronal development; blue node represented DNA binding proteins; green node represented nucleic proteins. (B) Red node represented ABC transporter-related proteins; blue node represented proteins that associated metabolic pathways.

Acknowledgments
This image is the copyrighted work of the attributed author or publisher, and ZFIN has permission only to display this image to its users. Additional permissions should be obtained from the applicable author or publisher of the image. Full text @ Genes (Basel)