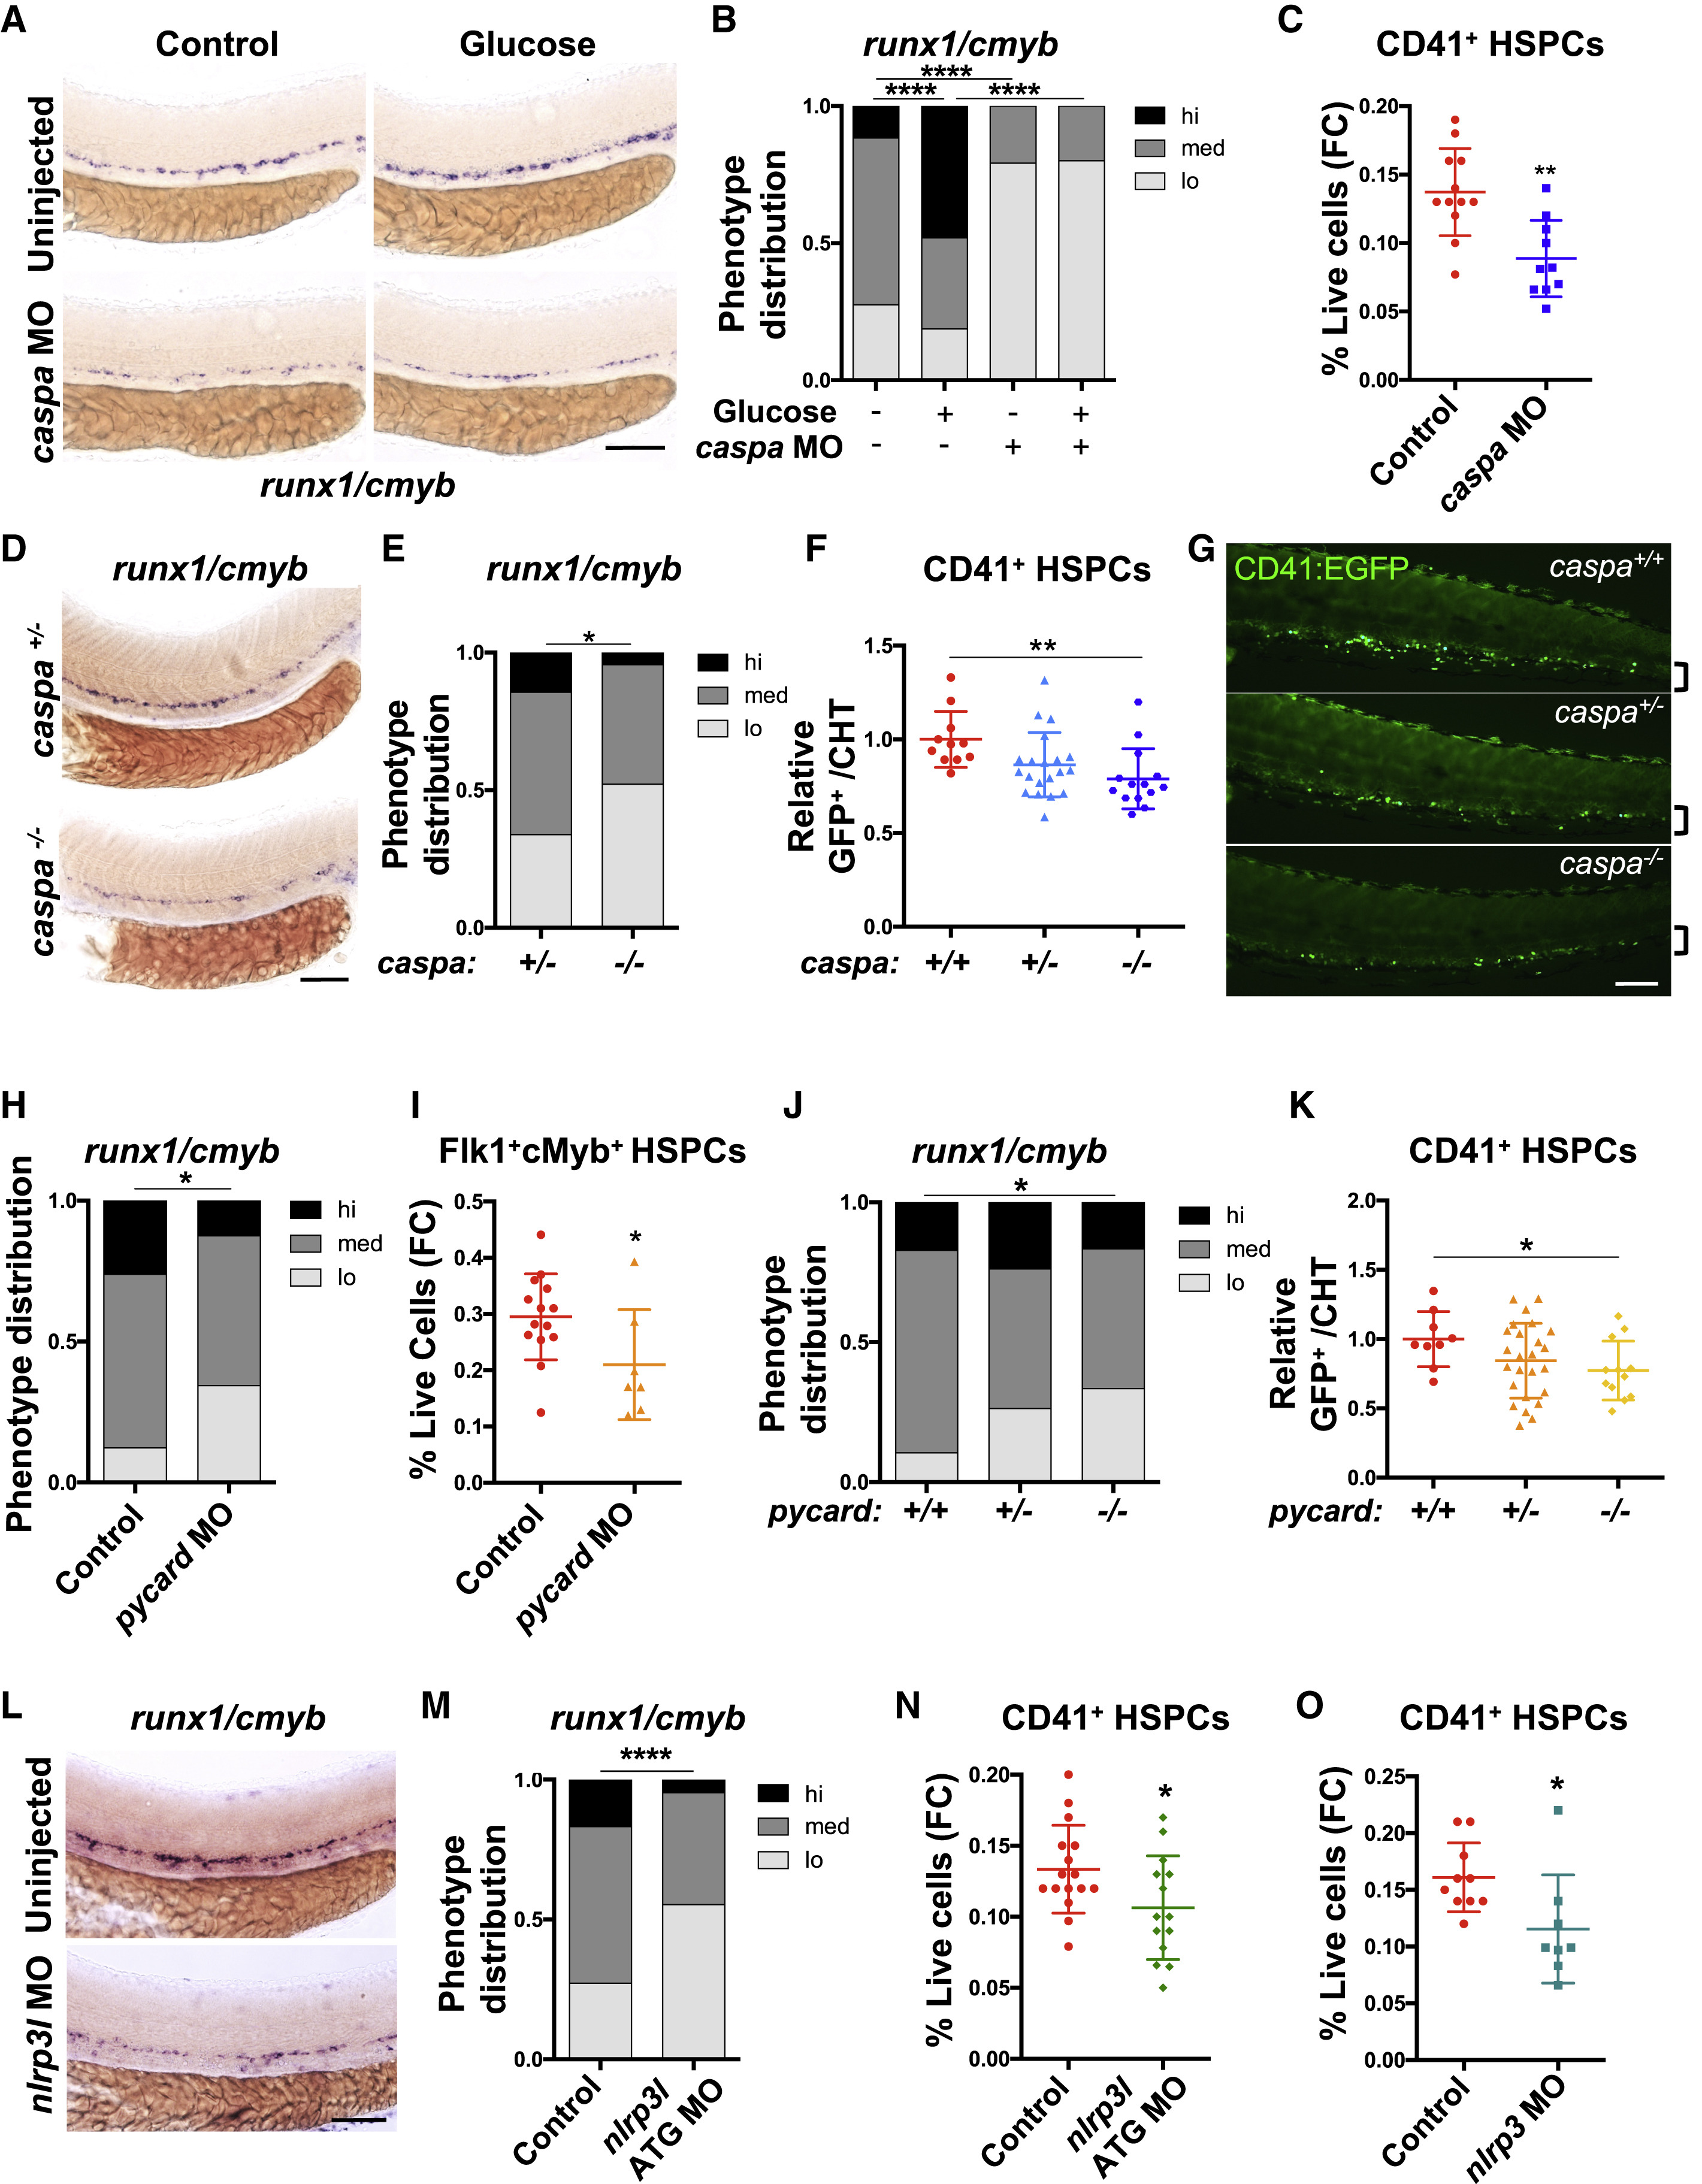
Fig. 2 Inflammasome Action Regulates HSPC Formation (A) Expression of runx1/cmyb in embryos with or without morpholino (MO)-mediated caspa knockdown or 1% glucose treatment (12–36 hpf) assessed by WISH. (B) Phenotypic distribution plot of runx1/cmyb expression scored in embryos from (A) (n ≥ 50 /condition). (C) caspa knockdown reduces the frequency of CD41:EGFP+ HSPCs by flow cytometry (FC) at 48 hpf. (D) runx1/cmyb WISH in caspa+/− and caspa−/− embryos at 36 hpf. (E) Phenotypic distribution plot of runx1/cmyb expression scored in embryos from (D) (n ≥ 46 /condition). (F) CD41:EGFP+ HSPCs in the CHT of embryos from caspa+/− incrosses at 48 hpf. Counts normalized relative to caspa+/+ embryos for each clutch. Significance determined by Tukey’s multiple comparison test. (G) Representative in vivo images of CD41+ HSPCs in the CHT region (brackets) in embryos from (F). (H) pycard knockdown reduces runx1/cmyb expression by WISH (36 hpf; n ≥ 32 / condition). (I) pycard knockdown decreases the frequency of HSPCs in Tg(flk1:dsRed;cmyb:egfp) embryos by flow cytometry (48 hpf). (J) runx1/cmyb WISH in pycard−/− embryos compared with stage-matched pycard+/+ and pycard+/− embryos (n ≥ 29/condition). (K) CD41+ HSPCs in the CHT of embryos from pycard+/− incrosses. Counts were normalized relative to pycard+/+ embryos for each clutch. Significance was determined by Fisher’s LSD test. (L) runx1/cmyb expression in the aorta with or without nlrp3l knockdown. (M) Phenotypic distribution plot of embryo cohorts from (L) (n ≥ 85/condition). (N) nlrp3l knockdown decreases the frequency of HSPCs assayed by flow cytometry at 48 hpf. (O) nlrp3 knockdown reduces the frequency of CD41+ HSPCs at 48 hpf. ∗p < 0.05, ∗∗p < 0.01, ∗∗∗p < 0.001, ∗∗∗∗p < 0.0001. Scale bars, 100 μm. Error bars indicate SD. See also Figure S2.
Reprinted from Developmental Cell, 55(2), Frame, J.M., Kubaczka, C., Long, T.L., Esain, V., Soto, R.A., Hachimi, M., Jing, R., Shwartz, A., Goessling, W., Daley, G.Q., North, T.E., Metabolic Regulation of Inflammasome Activity Controls Embryonic Hematopoietic Stem and Progenitor Cell Production, 133-149.e6, Copyright (2020) with permission from Elsevier. Full text @ Dev. Cell

