IMAGE

Fig. 5

ID
ZDB-IMAGE-201121-35
Source
Figures for Kondrychyn et al., 2020
Image
Figure Caption

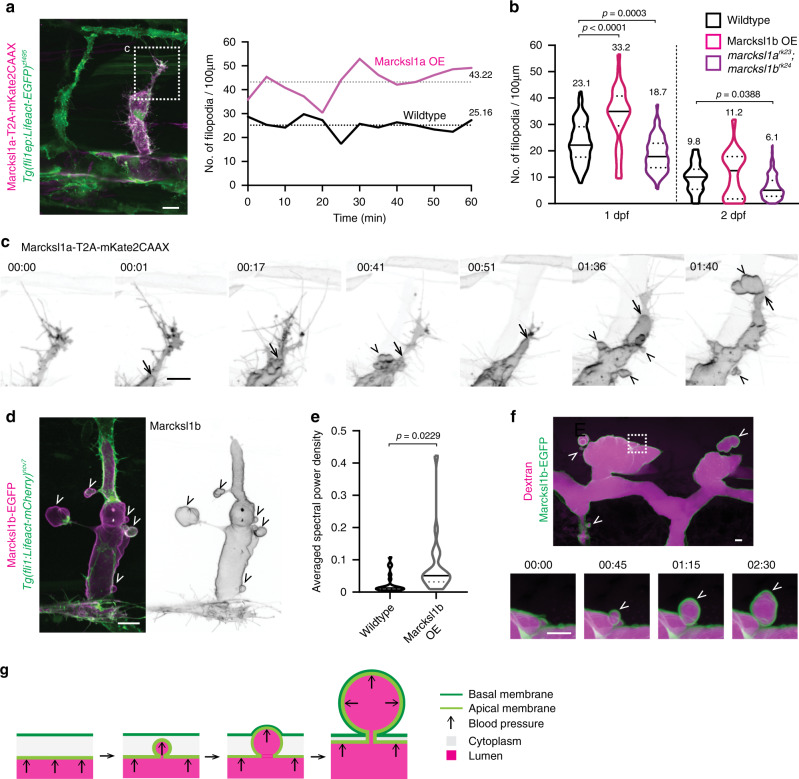
Fig. 5 Marckls1 regulates endothelial membrane behaviour during ISV formation.

a, b Marcksl1 regulates filopodia formation. Increased expression of Marcksl1a in ECs (magenta) increases filopodia formation when compared to wildtype EC (green) at 31 hpf (a). Dashed box, region of vessel measured. Quantification of wildtype EC or ECs overexpressing Marcksl1b (Marcksl1b OE) or depleted of marcksl1a and marcksl1b at 1 and 2 dpf (b, 1 dpf: wildtype, n = 87 ISVs/ 29 embryos; Marcksl1b OE, n = 32 ISVs/19 embryos; marcksl1ark23;marcksl1brk24, n = 67 ISVs/16 embryos. 2 dpf: wildtype, n = 29 ISVs/10 embryos; Marcksl1b OE, n = 18 ISVs/15 embryos; marcksl1ark23;marcksl1brk24, n = 126 ISVs/28 embryos). Statistical significance was assessed by ordinary one-way ANOVA with Sidak’s multiple comparisons test. Mean values are indicated. c Overexpression of Marcksl1a in ECs causes ectopic membrane blebbing during lumen expansion. Apical membrane (arrow) of an endothelial tip cell expands until the leading edge of the tip cell, at which point ectopic basal blebs (arrowhead) protrude into the surrounding tissue. Movies were taken from 31 hpf. d Overexpressing of Marcksl1b in EC (magenta) induces ectopic basal blebs (arrowhead) in the ISV of 54 hpf embryo. e Quantification of membrane blebbing shows a significant increase in blebbing in ECs with increased expression of Marcksl1b when compared to wildtype EC of ISVs in 2 dpf Tg(kdr-l:ras-mCherry)s916 embryos (wildtype, n = 21 cells; Marcksl1b OE, n = 20 cells). Statistical significance was assessed by two-tailed unpaired t test with Welch’s correction. f, g Marcksl1-induced blebs are comprised of apical and basal membranes (green). Newly formed basal blebs (arrowhead) are filled with Dextran (magenta). 00:00; minutes:seconds. Dashed box in f, a magnified region. Violin plots in b, e represent the entire range of values, dotted lines indicate first and third quartiles, center lines are median. Scale bars, 5 µm (f) and 10 µm (a, c, d). Source data are provided as a Source data file.

Acknowledgments
This image is the copyrighted work of the attributed author or publisher, and ZFIN has permission only to display this image to its users. Additional permissions should be obtained from the applicable author or publisher of the image. Full text @ Nat. Commun.