IMAGE

FIGURE 7

ID
ZDB-IMAGE-201121-129
Source
Figures for Demirci et al., 2020
Image
Figure Caption

FIGURE 7

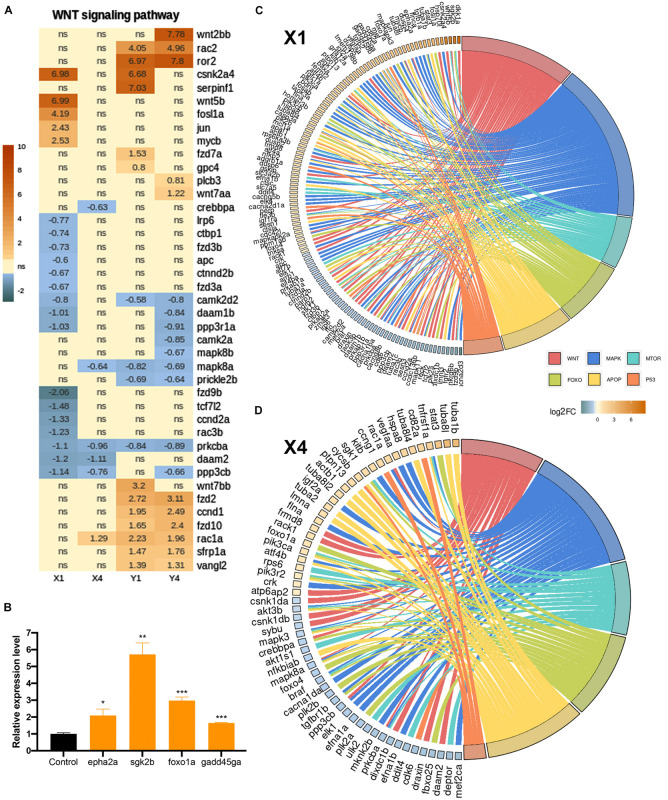
Inhibition of Wnt/β-catenin signaling during the early wound stage results in a marked alteration of the gene expression profiles represented in Kyoto Encyclopedia of Genes and Genomes (KEGG) pathway enrichment. Heatmap representation of the uniquely changed genes in (A) the Wnt signaling pathway in X1, X4, Y1, and Y4 comparisons. Each column represents a comparison according to the DESeq2 results and each row shows a single gene. The scale bar shows log2 of the fold change values (when statistically significant) from high to low fold change, represented by a color gradient from orange to blue, respectively. Statistical significance was evaluated using Wald test. ns, non-significant. (B,C) GOChord plot of selected GO terms belonging to the biological process (BP) sub-ontology and KEGG pathways for X1 and X4 comparisons, respectively. The genes related to the Wnt-KEGG pathway and Wnt-Gene Ontology BP are intersected and represented as one group. The genes are linked to their assigned pathways by ribbons and ordered according to their log2 of the fold change values from high to low fold change, represented by a color gradient from orange to blue, respectively. (D) Relative expression levels of pathway-related genes (epha2a, sgk2b, foxo1a, and gadd45ga). Statistical significance was evaluated using unpaired t-test. *p < 0.05, **p < 0.01, and ***p < 0.001. Error bars represent ± standard error of the mean (SEM, n = 3). See section “Materials and Methods” for the definition of DEGs covered in X and Y comparisons.

Acknowledgments
This image is the copyrighted work of the attributed author or publisher, and ZFIN has permission only to display this image to its users. Additional permissions should be obtained from the applicable author or publisher of the image. Full text @ Front Cell Dev Biol