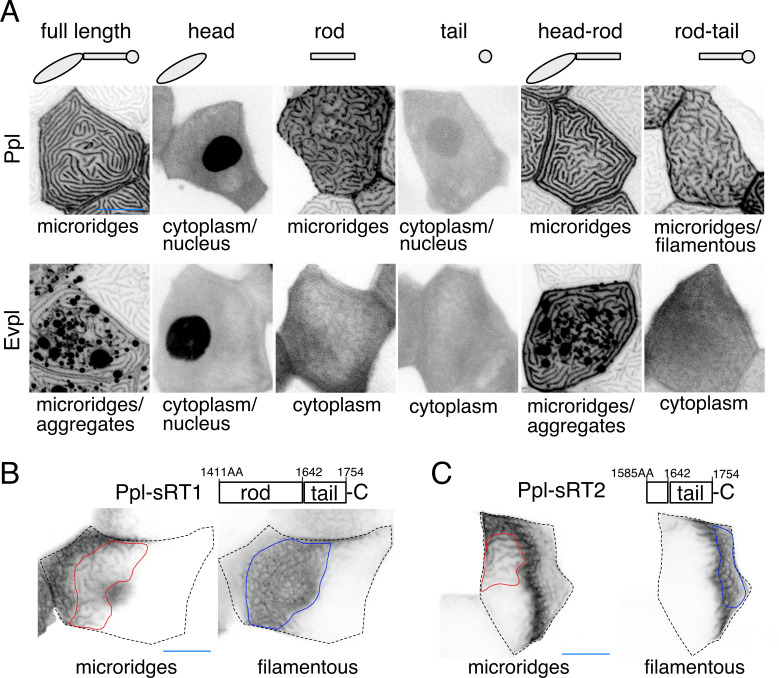
Figure 5 (A) Periderm cells expressing Evpl-tdTomato and Ppl-GFP variants at 48hpf. Schematics indicate the domains in each variant. (B–C) Optical sections of GFP-tagged Ppl truncated rod-tail fusions expressed in periderm cells at 48hpf. Sections highlight the microridge-like pattern at the apical surface of cells (left, red outlines) or the filamentous pattern deeper in cells (right, blue outlines). Top: Diagram of Ppl protein domains. Amino acid numbers are indicated. See Figure 5—video 1 for video showing apical-to-basal sections of these images. Images were inverted so that high-intensity fluorescence appears black and low-intensity fluorescence is white. Scale bars: 10 µm.
Image
Figure Caption
Acknowledgments
This image is the copyrighted work of the attributed author or publisher, and
ZFIN has permission only to display this image to its users.
Additional permissions should be obtained from the applicable author or publisher of the image.
Full text @ Elife

