IMAGE

Figure 4

ID
ZDB-IMAGE-201003-46
Source
Figures for Zhang et al., 2020
Image
Figure Caption

Figure 4

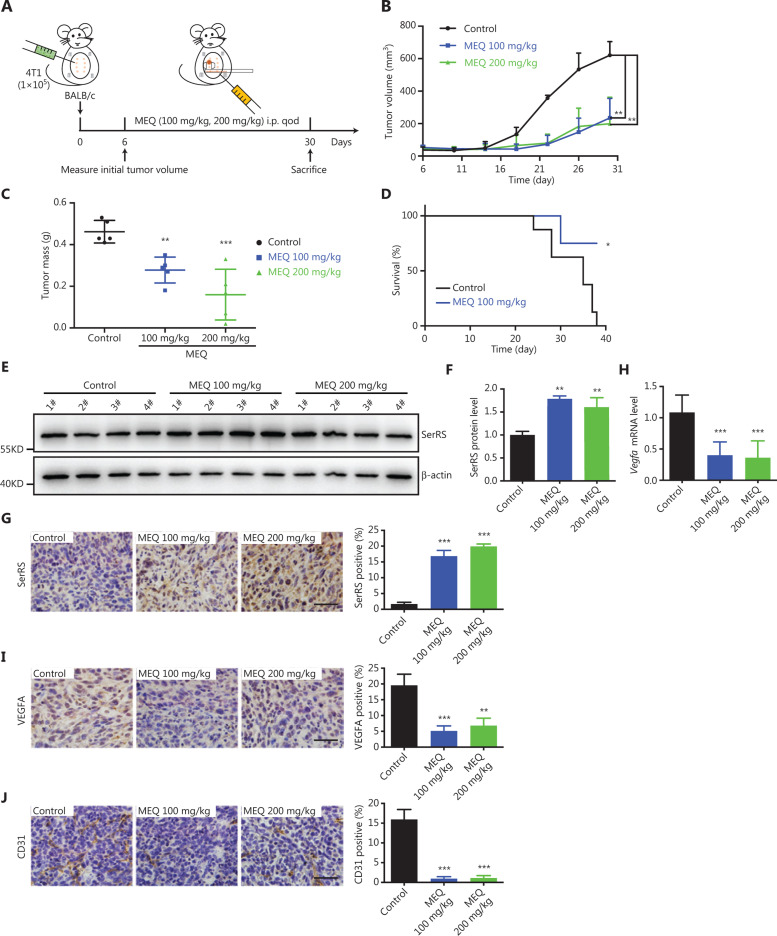
MEQ suppressed the progression of breast cancer allografts in mice. (A) Scheme of mouse experiments based on the breast cancer allograft model. qod: quaque omni die. (B) Tumor growth curve. (n = 5, **P < 0.01 using the Student’s t-test.). (C) Tumor weights at 30 days post-inoculation. (n = 5, **P < 0.01; ***P < 0.001 using Student’s t-test). (D) Kaplan-Meier survival curves of tumor-bearing Balb/c mice treated with MEQ (100 mg/kg) or dimethyl sulfoxide control (n = 8, *P < 0.05 using the log-rank test). (E, F) Western blotting to show SerRS protein levels in tumor tissues (E) and the densitometry quantification. (F) Data are plotted as the mean ± SEM (n = 4; **P < 0.01; ***P < 0.001 using Student’s t-test). (G) Immunohistochemical staining of SerRS in tumor tissue and its quantification (n = 5; ***P < 0.001 using Student’s t-test). (H) The qRT-PCR shows VEGFA mRNA levels of tumor tissues. (I, J) Immunohistochemical staining of VEGFA (I) and CD31 (J) in tumor tissues and quantification of positive cell numbers plotted as the mean ± SEM (n = 5; **P < 0.01; ***P < 0.001 using Student’s t-test). All scale bars represent 100 μm.

Acknowledgments
This image is the copyrighted work of the attributed author or publisher, and ZFIN has permission only to display this image to its users. Additional permissions should be obtained from the applicable author or publisher of the image. Full text @